ECharts之类型map(省级,地级市)
一、效果:
1.广东地图

2.深圳地图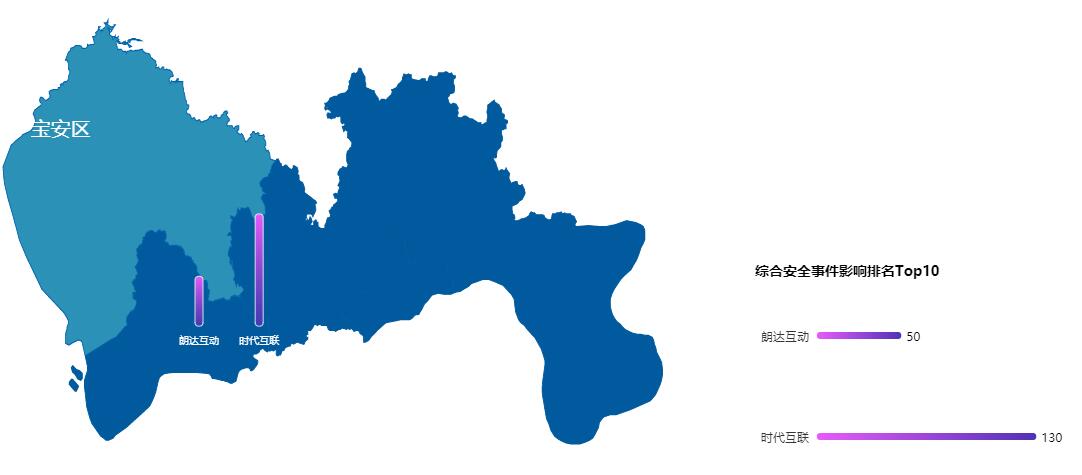
二、项目结构:
1.广东地图

2.深圳地图

三、项目介绍:
1.广东地图:
地图包含三个模块,①广东地图图表是用geo,不是series因为只作为背景(可捕捉点击地级市事件)。②地图上的条形图是根据坐标地位的③左下角的条形图是根据grid来定位的。
2.深圳市地图:(与广东地图一样)
四、源码
1.广东地图:


  1 <!DOCTYPE html>
  2 <html>
  3 <head>
  4     <link rel='icon' href='w.ico' type='image/x-icon'>
  5     <title>广东地图2D</title>
  6     <meta http-equiv="content-type" content="text/html; charset=utf-8">
  7     <script src="echarts.min.js"></script>
  8     <script src="echarts-gl.min.js"></script>
  9     <!-- <script src="http://echarts.baidu.com/resource/echarts-gl-latest/dist/echarts-gl.min.js"></script> -->
 10     <script src="guangdong.js"></script>
 11     <script src="jquery-3.2.1.js"></script>
 12
 13     <style type="text/css">
 14     #id1 {
 15
 16         border:2px solid green;
 17         height: 450px;
 18
 19     }
 20
 21 </style>
 22
 23 </head>
 24
 25 <body>
 26     <div id="id1"></div>
 27
 28
 29     <script>
 30         var rawData = [
 31         {name: '珠海市',value:130},
 32         {name: '广州市',value: 50},
 33         {name: '中山市',value:30},
 34         {name: '佛山市',value: 50},
 35         {name: '清远市',value:30},
 36         {name: '梅州市',value: 50},
 37         {name: '汕头市',value:30},
 38         {name: '东莞市',value: 50},
 39         {name: '惠州市',value:30},
 40         {name: '深圳市',value: 50}
 41         ];
 42
 43         function Map(id,cityData){
 44
 45             function sortRule(a,b){return a.value-b.value;}
 46             cityData.sort(sortRule);
 47             var name=cityData.map(name=>name.name);
 48
 49             var chart =  echarts.init(document.getElementById(id));
 50
 51             var geoCoordMap = {
 52             '珠海市': [113.353986,21.924979]
 53             ,'广州市':[113.480637,23.125178]
 54             ,'湛江市':[110.264977,21.274898]
 55             ,'茂名市':[110.919229,21.659751]
 56             ,'阳江市':[111.825107,21.859222]
 57             ,'云浮市':[112.044439,22.629801]
 58             ,'肇庆市':[112.472529,23.051546]
 59             ,'江门市':[112.894942,22.090431]
 60             ,'中山市':[113.382391,22.321113]
 61             ,'佛山市':[113.022717,22.828762]
 62             ,'清远市':[113.051227,23.685022]
 63             ,'韶关市':[113.591544,24.501322]
 64             ,'河源市':[114.897802,23.746266]
 65             ,'梅州市':[116.117582,24.099112]
 66             ,'潮州市':[116.692301,23.661701]
 67             ,'揭阳市':[116.255733,23.143778]
 68             ,'汕头市':[116.708463,22.87102]
 69             ,'汕尾市':[115.364238,22.774485]
 70             ,'深圳市':[114.085947,22.347]
 71             ,'东莞市':[113.746262,22.746237]
 72             ,'惠州市':[114.412599,23.079404]
 73         };
 74
 75         var option = {
 76             legend: [],
 77             xAxis: [{
 78                 type: "value",
 79                 axisLine: {
 80                     show: false
 81                 },
 82                 axisTick: {
 83                     show: false
 84                 },
 85                 axisLabel: {
 86                     show: false
 87                 },
 88                 splitLine: {
 89                     show: false
 90                 }
 91             },],
 92             yAxis: [{
 93                 type: "category",
 94
 95                 axisLine: {
 96                     show: false
 97                 },
 98                 axisTick: {
 99                     show: false,
100                     alignWithLabel: true
101                 },
102                 axisLabel: {
103                     textStyle:{
104                        show:false
105                     }
106                 },
107                 data:name,
108             },],
109             grid: [{
110                 left: "70%",
111                 right: "20",
112                 bottom: "10",
113                 top:'60%',
114                 containLabel: true
115             },],
116             title:[{
117                 text:'全省安全态势',
118                 x:0,
119                 textStyle:{
120                     color:'rgb(0,147,203)',
121                     fontSize:14
122                 }
123             },{
124                 text: "综合安全事件影响排名Top10",
125                 textStyle: {
126                     color: "#000",
127                     fontWeight: "bold",
128                     fontSize: 14
129                 },
130                 top: "55%",
131                 left: "69%"
132             }],
133             tooltip:[{
134                 // formatter:function(params){
135                 //     console.log(params)
136                 //     var content='',
137                 //     content=params.name+params.value[0]+params.value[1]+params.value[2];
138                 //     return content;
139                 // },
140                 show:true,
141             }],
142             backgroundColor:'#fff',
143             // visualMap: {
144             //     show: false,
145             //     min: 0,
146             //     max: 3000,
147             //     inRange: {
148             //         color: ['#00ffff', '#006edd'],
149             //          color: ['#00467F', '#A5CC82']
150             //     },
151             //     calculable:true
152
153             // },
154
155             geo:{
156
157                 show:true,
158                 map:'广东',
159                 type:'map',
160                 label: {
161                     normal: {
162                         show: false
163                     },
164                     emphasis: {
165                         show: true,
166                         fontSize:15,
167                         fontWeight:'bold',
168                         color:'rgb(80,50,180)',
169                     }
170                 },
171                 roam: false,
172                 itemStyle: {
173                     normal: {
174                         areaColor: ['rgb(0,90,157)'],
175                         borderColor: '#fff',
176                         borderWidth: '0.8',
177                     },
178                     emphasis: {
179                         areaColor: '#2B91B7',
180                     }
181                 }
182             },
183             series: [{
184                 name: "安全事件数量",
185                 type: "bar",
186                 data: cityData,
187                 barWidth:7,
188                 barCategoryGap: "50%",
189                 label: {
190                     normal: {
191                         left:'right',
192                         show: true,
193                         position: "right",
194                         formatter: function(params) {
195                             console.log(params);
196                             return params.data.value;
197                         },
198                         textStyle: {
199                     color: "#000" //color of value
200                         }
201                     }
202                 },
203         itemStyle: {
204             normal: {
205                 color: new echarts.graphic.LinearGradient(0, 0, 1, 0, [{
206                     offset: 0,
207                     color: "rgb(231,91,250)" // 0% 处的颜色
208                 }, {
209                     offset: 1,
210                     color: "rgb(80,50,180)" // 100% 处的颜色
211                 }], false),
212                 barBorderRadius: [30, 30,30, 30],
213             }
214         }
215     },]
216
217         };//option
218         chart.setOption(option);
219
220         function renderEachCity() {
221             var width=$('#id1').width();
222             var height=$('#id1').height();
223             // option.xAxis.push();
224             // option.yAxis.push();
225             // option.grid.push();
226             // option.series.push();
227             echarts.util.each(rawData, function(dataItem, idx) {
228
229                 var geoCoord = geoCoordMap[dataItem.name];
230
231                 var coord = chart.convertToPixel('geo', geoCoord);
232                 console.log(geoCoord+":"+coord);
233                 idx += '';
234
235
236                 option.xAxis.push({
237                     id: idx,
238                     gridId: idx,
239                     type: 'category',
240                     show: false
241                 });
242                 option.yAxis.push({
243                     id: idx,
244                     gridId: idx,
245                     show: false
246                 });
247                 option.grid.push({
248                     id: idx,
249                      10,
250                     height: (dataItem.value),
251                     left: coord[0],
252                     bottom:height-coord[1]+10,
253                 });
254
255
256                 option.series.push({
257                     name:dataItem.name,
258                     type: 'bar',
259                     xAxisId: idx,
260                     yAxisId: idx,
261                     road:true,
262                     itemStyle: {
263                         normal: {
264                             color:new echarts.graphic.LinearGradient(0, 0, 0, 1, [{
265                                 offset: 0,
266                                 color: 'rgba(231,91,250,1)'
267                             }, {
268                                 offset: 1,
269                                 color: 'rgba(80,50,180,0.9)'
270                             }], false),
271                             barBorderRadius: [30, 30,30, 30],
272                              borderColor:'rgba(255,255,255,0.8)',
273                         },
274                         emphasis:{
275                             color:new echarts.graphic.LinearGradient(0, 0, 0, 1, [{
276                                 offset: 1,
277                                 color: 'rgb(231,91,250)'
278                             }, {
279                                 offset: 0,
280                                 color: 'rgb(80,50,180)'
281                             }], false)
282                         }
283                     },
284                     data: [dataItem.value]
285                 });
286
287
288             });
289             chart.setOption(option);
290         }
291
292         renderEachCity();
293
294
295         chart.on('click',function(params){console.log(params);})
296
297     }
298     Map('id1',rawData);
299 </script>
300 </body>
301 </html>
2.深圳市地图:
  1 <!DOCTYPE html>
  2 <html>
  3 <head>
  4     <link rel='icon' href='w.ico' type='image/x-icon'>
  5     <title>地级市地图2D</title>
  6     <meta http-equiv="content-type" content="text/html; charset=utf-8">
  7     <script src="echarts.min.js"></script>
  8     <script src="echarts-gl.min.js"></script>
  9     <!-- <script src="http://echarts.baidu.com/resource/echarts-gl-latest/dist/echarts-gl.min.js"></script> -->
 10     <script src="guangdong.js"></script>
 11     <script src="jquery-3.2.1.js"></script>
 12
 13     <style type="text/css">
 14     #id1 {
 15
 16         border:2px solid green;
 17         height: 530px;
 18         width:1097px;
 19
 20     }
 21
 22 </style>
 23
 24 </head>
 25
 26 <body>
 27     <div id="id1"></div>
 28
 29
 30     <script>
 31         var rawData = [
 32         {name: '时代互联',value:130},
 33         {name: '朗达互动',value: 50}
 34
 35         ];
 36
 37         function Map(id,cityData,cityName){
 38             var name=cityData.map(name=>name.name);
 39
 40
 41             var chart =  echarts.init(document.getElementById(id));
 42             $.getJSON('广东/'+cityName+'.json', function (usaJson) {
 43              echarts.registerMap('city', usaJson);
 44             var geoCoordMap = {
 45             '时代互联':[114.085947,22.547],
 46             '朗达互动':[114.005947,22.547],
 47             '飞远网络':[113.353986,21.924979],
 48             '科飞科技':[113.353986,21.924979],
 49             '明飞互联':[113.353986,21.924979],
 50             '万网网络':[113.353986,21.924979],
 51             '大朗科技':[113.353986,21.924979],
 52             '腾度科技':[112.353986,22.924979]
 53
 54
 55
 56         };
 57
 58         var option = {
 59             legend: [],
 60             xAxis: [{
 61                 type: "value",
 62                 axisLine: {
 63                     show: false
 64                 },
 65                 axisTick: {
 66                     show: false
 67                 },
 68                 axisLabel: {
 69                     show: false
 70                 },
 71                 splitLine: {
 72                     show: false
 73                 }
 74             },],
 75             yAxis: [{
 76                 type: "category",
 77
 78                 axisLine: {
 79                     show: false
 80                 },
 81                 axisTick: {
 82                     show: false,
 83                     alignWithLabel: true
 84                 },
 85                 axisLabel: {
 86                     textStyle:{
 87                        show:false
 88                     }
 89                 },
 90                 data:name,
 91             },],
 92             grid: [{
 93                 left: "70%",
 94                 right: "20",
 95                 bottom: "10",
 96                 top:'60%',
 97                 containLabel: true
 98             },],
 99             title:[{
100                 text:cityName+'IDC安全态势',
101                 x:0,
102                 textStyle:{
103                     color:'rgb(0,147,203)',
104                     fontSize:14
105                 }
106             },{
107                 text: "综合安全事件影响排名Top10",
108                 textStyle: {
109                     color: "#000",
110                     fontWeight: "bold",
111                     fontSize: 14
112                 },
113                 top: "55%",
114                 left: "69%"
115             }],
116             tooltip:[{
117                 // formatter:function(params){
118                 //     console.log(params)
119                 //     var content='',
120                 //     content=params.name+params.value[0]+params.value[1]+params.value[2];
121                 //     return content;
122                 // },
123                 show:true,
124             }],
125             backgroundColor:'#fff',
126             // visualMap: {
127             //     show: false,
128             //     min: 0,
129             //     max: 3000,
130             //     inRange: {
131             //         color: ['#00ffff', '#006edd'],
132             //          color: ['#00467F', '#A5CC82']
133             //     },
134             //     calculable:true
135
136             // },
137
138             geo:{
139                 left:'10',
140                 show:true,
141                 map:'city',
142                 type:'map',
143                 zlevel:0,
144                 label: {
145                     normal: {
146                         show: false
147                     },
148                     emphasis: {
149                         show: true,
150                         fontSize:20,
151                         color:'rgb(255,255,255)',
152                     }
153                 },
154                 roam: false,
155                 itemStyle: {
156                     normal: {
157                         color: 'rgb(0,90,157)',
158                         borderColor: 'rgb(0,90,157)',
159                         borderWidth: 1,
160                     },
161                     emphasis: {
162                         areaColor: '#2B91B7',
163
164
165
166                     }
167                 }
168             },
169             series: [{
170                 name: "安全事件数量",
171                 type: "bar",
172                 data: cityData,
173                 barWidth:7,
174                 barCategoryGap: "50%",
175                  zlevel:2,
176                 label: {
177                     normal: {
178                         left:'right',
179                         show: true,
180                         position: "right",
181                         formatter: function(params) {
182                             console.log(params);
183                             return params.data.value;
184                         },
185                         textStyle: {
186                     color: "#000" //color of value
187                         }
188                     }
189                 },
190         itemStyle: {
191             normal: {
192                 color: new echarts.graphic.LinearGradient(0, 0, 1, 0, [{
193                     offset: 0,
194                     color: "rgb(231,91,250)" // 0% 处的颜色
195                 }, {
196                     offset: 1,
197                     color: "rgb(80,50,180)" // 100% 处的颜色
198                 }], false),
199                 barBorderRadius: [30, 30,30, 30],
200             }
201         }
202     },]
203
204         };//option
205         chart.setOption(option);
206
207         function renderEachCity() {
208             var width=$('#'+id).width();
209             var height=$('#'+id).height();
210             // option.xAxis.push();
211             // option.yAxis.push();
212             // option.grid.push();
213             // option.series.push();
214             echarts.util.each(rawData, function(dataItem, idx) {
215
216                 var geoCoord = geoCoordMap[dataItem.name];
217                 console.log(dataItem.name);
218                 var coord = chart.convertToPixel('geo', geoCoord);
219                 console.log(geoCoord+":"+coord);
220                 idx += '';
221
222                 console.log(dataItem.name)
223                 option.xAxis.push({
224                     id: idx,
225                     gridId: idx,
226                     type: 'category',
227                     //show: true,
228                     data:[dataItem.name],
229                     boundaryGap:true,
230                     axisLine: {
231                         show: false
232                     },
233                     axisTick: {
234
235
236                         show: false,
237
238                     },
239                     axisLabel: {
240                         interval:0,
241                         fontSize:10,
242
243                         color: "#fff",
244
245
246
247                     }
248                 });
249                 option.yAxis.push({
250                     id: idx,
251                     gridId: idx,
252                     show: false
253                 });
254                 option.grid.push({
255                     id: idx,
256                      10,
257                     height: (dataItem.value),
258                     left: coord[0],
259                     bottom:height-coord[1]+10,
260                 });
261
262
263                 option.series.push({
264                     name:dataItem.name,
265                     type: 'bar',
266                     xAxisId: idx,
267                     yAxisId: idx,
268                      zlevel:1,
269                     road:true,
270                     itemStyle: {
271                         normal: {
272                             color:new echarts.graphic.LinearGradient(0, 0, 0, 1, [{
273                                 offset: 0,
274                                 color: 'rgba(231,91,250,1)'
275                             }, {
276                                 offset: 1,
277                                 color: 'rgba(80,50,180,0.8)'
278                             }], false),
279                             borderColor:'rgba(255,255,255,0.8)',
280                             barBorderRadius: [30, 30,30, 30],
281                         },
282                         emphasis:{
283                             color:new echarts.graphic.LinearGradient(0, 0, 0, 1, [{
284                                 offset: 1,
285                                 color: 'rgb(231,91,250)'
286                             }, {
287                                 offset: 0,
288                                 color: 'rgb(80,50,180)'
289                             }], false)
290                         }
291                     },
292                     data: [dataItem.value]
293                 });
294
295
296             });
297             chart.setOption(option);
298         }
299
300         renderEachCity();
301
302
303         chart.on('click',function(params){console.log(params);})
304     });
305     }
306     Map('id1',rawData,'深圳市');
307 </script>
308 </body>
309 </html>