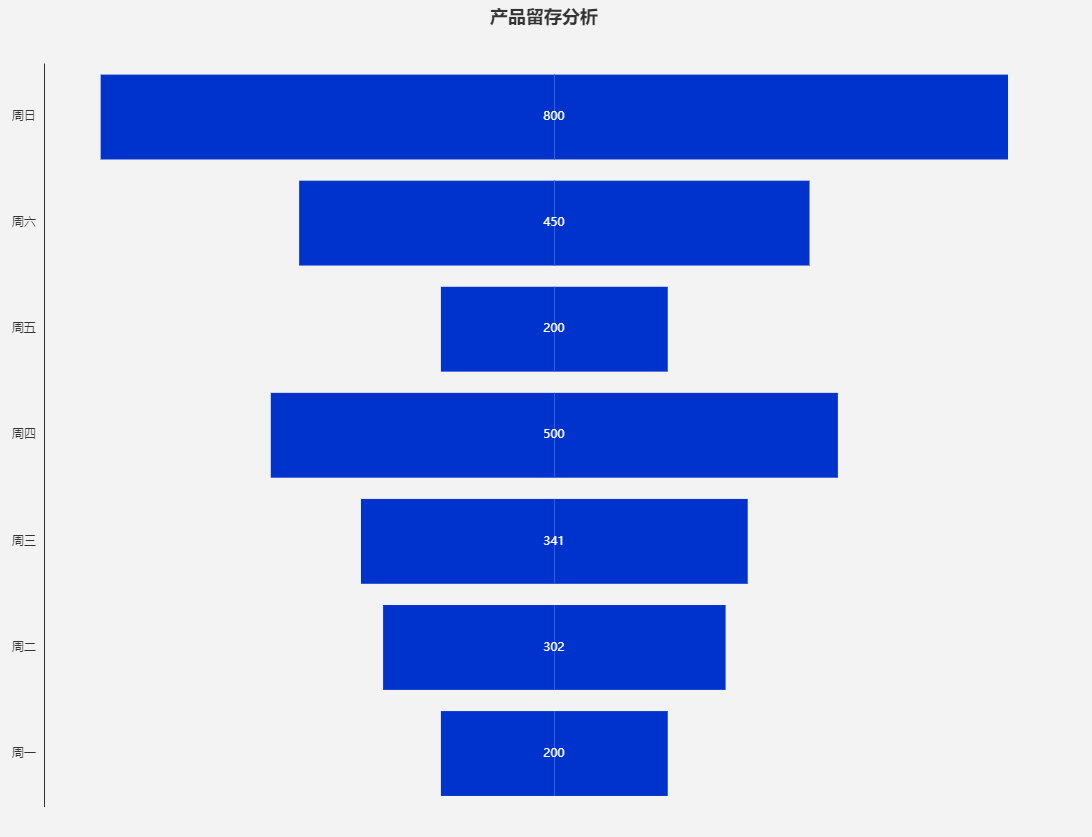
option = {
    title: {
        show: true,
        text: '产品留存分析',
        textAlign: 'auto',
        left: 'center'
    },
    tooltip: {
        show: false,
        trigger: 'axis',
        axisPointer: {            // 坐标轴指示器,坐标轴触发有效
            type: 'shadow'        // 默认为直线,可选为:'line' | 'shadow'
        }
    },
    legend: {
        show: false,
        data: ['利润', '支出', '收入']
    },
    grid: {
        left: '3%',
        right: '4%',
        bottom: '3%',
        containLabel: true
    },
    xAxis: [
        {
            type: 'value',show:false,
            splitLine:{
            show:false
          },
            axisTick: {
                show: false
            },
        }
    ],
    yAxis: [
        {
            type: 'category',
            axisTick: {
                show: false
            },
            axisLine:{
                show: true,
                onZero:false,

            },
            axisTick: {
                show: false
            },
            data: ['周一', '周二', '周三', '周四', '周五', '周六', '周日'],

            splitLine:{
            show:false
          }

        }
    ],
    color: ['#0033cc'],
    series: [
        {
            name: '支出',
            type: 'bar',
            stack: '总量',
            label: {
                show: false,
                color:'white',
                // position: 'insideRight',
                // distance: -11
            },
            data: [-200, -302, -341, -500, -200, -450, -800]
        },
        {
            name: '收入',
            type: 'bar',
            stack: '总量',
            z:10,//防止数字被覆盖
            label: {
                show: true,
                color:'white',
                position: 'insideLeft',
                distance: -11
            },
            data: [200, 302, 341, 500, 200, 450, 800]
        }
    ]
};
效果如下: