1、subplot2grid
使用import导入matplotlib.pyplot模块, 并简写成plt. 使用plt.figure()创建一个图像窗口
import matplotlib.pyplot as plt

plt.figure()
使用plt.subplot2grid来创建第1个小图, (3,3)表示将整个图像窗口分成3行3列, (0,0)表示从第0行第0列开始作图,colspan=3表示列的跨度为3, rowspan=1表示行的跨度为1.colspan和rowspan缺省, 默认跨度为1.
ax1 = plt.subplot2grid((3, 3), (0, 0), colspan=3)
ax1.plot([1, 2], [1, 2])    # 画小图
ax1.set_title('ax1_title')  # 设置小图的标题
使用plt.subplot2grid来创建第2个小图, (3,3)表示将整个图像窗口分成3行3列, (1,0)表示从第1行第0列开始作图,colspan=2表示列的跨度为2. 同上画出 ax3, (1,2)表示从第1行第2列开始作图,rowspan=2表示行的跨度为2. 再画一个 ax4 和 ax5, 使用默认 colspan, rowspan.
ax2 = plt.subplot2grid((3, 3), (1, 0), colspan=2)
ax3 = plt.subplot2grid((3, 3), (1, 2), rowspan=2)
ax4 = plt.subplot2grid((3, 3), (2, 0))
ax5 = plt.subplot2grid((3, 3), (2, 1))
使用ax4.scatter创建一个散点图, 使用ax4.set_xlabel和ax4.set_ylabel来对x轴和y轴命名.
ax4.scatter([1, 2], [2, 2])
ax4.set_xlabel('ax4_x')
ax4.set_ylabel('ax4_y')
plt.show()

2、subplots
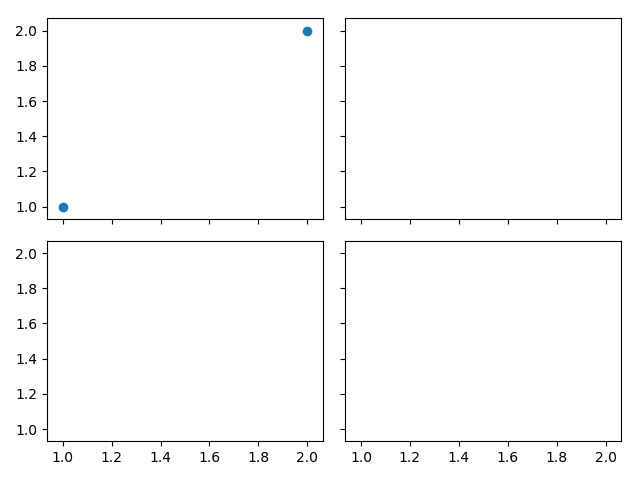
使用plt.subplots建立一个2行2列的图像窗口,sharex=True表示共享x轴坐标, sharey=True表示共享y轴坐标. ((ax11, ax12), (ax13, ax14))表示第1行从左至右依次放ax11和ax12, 第2行从左至右依次放ax13和ax14.
f, ((ax11, ax12), (ax13, ax14)) = plt.subplots(2, 2, sharex=True, sharey=True)
使用ax11.scatter创建一个散点图.
ax11.scatter([1,2], [1,2])
plt.tight_layout()表示紧凑显示图像, plt.show()表示显示图像.
plt.tight_layout()
plt.show()