今天看了下微博,扔物线分享了个内存检测的工具:
LeakCanary: Detect all memory leaks!
java.lang.OutOfMemoryError
        at android.graphics.Bitmap.nativeCreate(Bitmap.java:-2)
        at android.graphics.Bitmap.createBitmap(Bitmap.java:689)
        at com.squareup.ui.SignView.createSignatureBitmap(SignView.java:121)
没有任何人会喜欢OOM问题的出现
In Square Register, we draw the customer's signature on a bitmap cache. This bitmap is the size of the device's screen, and we had a significant number of out of memory (OOM) crashes when creating it.
这个图片的大小是设备大小,我们在显示这个图片的时候会出现OOM的问题。

We tried a few approaches, none of which solved the issue:
我们尝试了一些方法,其中没有解决的问题:
- Use
Bitmap.Config.ALPHA_8(a signature doesn't need color). - 使用bitmap.config.alpha_8
- Catch
OutOfMemoryError, trigger the GC and retry a few times (inspired from GCUtils). - 抓住OutOfMemoryError,触发GC和重试几次(灵感来自gcutils)。
- We didn't think of allocating bitmaps off the Java heap. Lucky for us, Fresco didn't exist yet.
- 我们不想把Java堆分配位图。幸运的是,Fresco 这个开源项目不存在这种问题。
We were looking at it the wrong way
The bitmap size was not a problem. When the memory is almost full, an OOM can happen anywhere. It tends to happen more often in places where you create big objects, like bitmaps. The OOM is a symptom of a deeper problem: memory leaks.
位图是没问题的,如果内存满的话,一个oom会出现在任何地方。当你创建比较大的对象,像bitmap这种东西的地方就会出现这种问题,oom更深层次的问题就是内存泄漏的问题。
What is a memory leak?
Some objects have a limited lifetime. When their job is done, they are expected to be garbage collected. If a chain of references holds an object in memory after the end of its expected lifetime, this creates a memory leak. When these leaks accumulate, the app runs out of memory.
许多对象是有有限制的生命周期的,当他们工作完成后,就会被垃圾回收。当对象的引用在对象的生命周期后还在持有该引用的话,就会出现内存泄漏的问题。当引用累计到一定一定时候,就会出现OOM的问题。
For instance, after Activity.onDestroy() is called, the activity, its view hierarchy and their associated bitmaps should all be garbage collectable. If a thread running in the background holds a reference to the activity, then the corresponding memory cannot be reclaimed. This eventually leads to an OutOfMemoryError crash.
例如,在Actiivity ondestroy()后,它的视图层次结构及其相关的位图应该都是垃圾收集。如果一个线程在后台运行,持有该activity引用,那么相应的内存不能被回收。这最终导致OutOfMemoryError错误,崩溃。
捕获OOM的问题
Hunting memory leaks is a manual process, well described in Raizlabs’ Wrangling Dalvik series.
捕获OOM的问题是一个手动的过程。
Here are the key steps:
关键步骤如下:
- Learn about
OutOfMemoryErrorcrashes via Bugsnag, Crashlytics, or the Developer Console. 在使用Bugsnag, Crashlytics以及 Developer Console工具去检测OutOfMemoryError这种问题。- Attempt to reproduce the problem. You might need to buy, borrow, or steal the specific device that suffered the crash. (Not all devices will exhibit all leaks!) You also need to figure out what navigation sequence triggers the leak, possibly by brute force.
- 重现问题,你可能需要购买或者借到一些特殊的设备来重现crash问题(并不是所有的设备都会出现这种问题),你需要知道是什么导致内存泄漏的问题,有可能是蛮力(这句翻译的有点怪,我擦)。
- Dump the heap when the OOM occurs (here's how).
- 堆积OOM的问题
- Poke around the heap dump with MAT or YourKit and find an object that should have been garbage collected.
- 使用MAT或者 YourKit 工具去发现那些对象应该被回收。
- Compute the shortest strong reference path from that object to the GC roots.
- 计算最短路径的强引用对象的GC根。
- Figure out which reference in the path should not exist, and fix the memory leak.
- 找出那些引用是不应该存在的,并处理内存对这些引用。
What if a library could do all this before you even get to an OOM, and let you focus on fixing the memory leak?
如果有一个库帮助你在oom问题出现之前去检测OOM的问题,你会去关注如何修复内存引用的问题吗?
介绍使用LeakCanary
LeakCanary is an Open Source Java library to detect memory leaks in your debug builds.
LeakCanary是一个开源项目,通过java库去检测内存泄漏的问题。
Let's look at a cat example:
看下下面的例子:
class Cat {
}
class Box {
  Cat hiddenCat;
}
class Docker {
  static Box container;
}

// ...

Box box = new Box();
Cat schrodingerCat = new Cat();
box.hiddenCat = schrodingerCat;
Docker.container = box;
You create a RefWatcher instance and give it an object to watch:
你创造了一个refwatcher实例,给它一个对象去检测:
// We expect schrodingerCat to be gone soon (or not), let's watch it.
refWatcher.watch(schrodingerCat);
When the leak is detected, you automatically get a nice leak trace:
当内存检测的时候,你会检测到内存的内存的使用的痕迹。
* GC ROOT static Docker.container
* references Box.hiddenCat
* leaks Cat instance
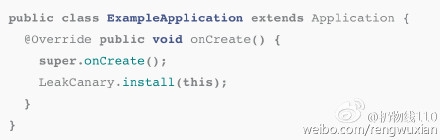
We know you're busy writing features, so we made it very easy to setup. With just one line of code, LeakCanary will automatically detect activity leaks:
public class ExampleApplication extends Application {
  @Override public void onCreate() {
    super.onCreate();
    LeakCanary.install(this);
  }
}
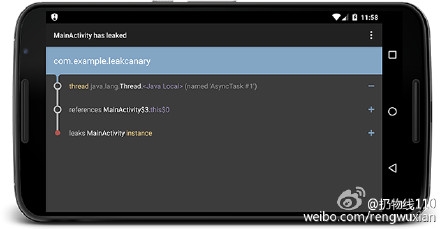
You get a notification and a nice display out of the box:
你能得到通知,并且能够良好的展示在界面上:

Conclusion
After enabling LeakCanary, we discovered and fixed many memory leaks in our app. We even found a few leaks in the Android SDK.
在启用的leakcanary,我们能够发现并修复你APP里面出现的内存泄漏的问题。我们甚至发现了一些 leaks in the Android SDK。
The results are amazing. We now have 94% fewer crashes from OOM errors.
结果让人吃惊,能够检测出94%的OOM的问题。

If you want to eliminate OOM crashes, install LeakCanary now!