Anveshak:在野外放置边缘服务器
本文为SIGCOMM 2018 Workshop (Mobile Edge Communications, MECOMM)论文。
笔者翻译了该论文。由于时间仓促,且笔者英文能力有限,错误之处在所难免;欢迎读者批评指正。
本文及翻译版本仅用于学习使用。如果有任何不当,请联系笔者删除。
本文作者包含4位,University of Helsinki, Finland的Nitinder Mohan,Aleksandr Zavodovski,Pengyuan Zhou和Jussi Kangasharju
ABSTRACT (摘要)
Edge computing provides an attractive platform for bringing data and processing closer to users in networked environments. Several edge proposals aim to place the edge servers at a couple hop distance from the client to ensure lowest possible compute and network delay. An attractive edge server placement is to co-locate it with existing (cellular) base stations to avoid additional infrastructure establishment costs. However, determining the exact locations for edge servers is an important question that must be resolved for optimal placement. In this paper, we present Anveshak, a framework that solves the problem of placing edge servers in a geographical topology and provides the optimal solution for edge providers. Our proposed solution considers both end-user application requirements as well as deployment and operating costs incurred by edge platform providers. The placement optimization metric of Anveshak considers the request pattern of users and existing user-established edge servers. In our evaluation based on real datasets, we show that Anveshak achieves 67% increase in user satisfaction while maintaining high server utilization.
边缘计算为网络环境中数据和处理接近用户提供了具有吸引力的平台。一些边缘方案的目标是将边缘服务器放置到距离客户端几跳远的位置,以保证可能的最低计算和网路延迟。一种具有吸引力的边缘服务器放置是将其和现有的(蜂窝)基站放置在一起,以避免额外的基础设施建设开销。然而,确定边缘服务器的准确位置是一个重要的问题,其解决方案必须是最优放置。本文中,我们给出Anveshak框架,该框架在地理拓扑中解决边缘服务器放置问题,并为边缘提供商提供最优方案。我们提出的方案同时考虑了终端用户应用需求和边缘平台提供商的部署和运维成本。Anveshak的放置优化度量标准考虑了用户的请求模式和现有的用户建立的边缘服务器。基于真实数据集的评估表明Anveshak在保持较高服务器利用率的同时取得67%的用户满意度增长。
1 INTRODUCTION (引言)
Novel applications, such as the Internet of Things (IoT) and augmented and virtual reality, have exponentially increased the amount of data generated and transported over the network. To mitigate the response time and handle large-scale data analysis closer to the users and data generators, the researchers have proposed edge clouds. As the name suggests, edge cloud is a consolidation of compute servers deployed very close to end user with limited compute, storage and network capability [1, 12, 22]. The central objective of edge clouds is to ensure low network delays for latency-critical applications such as autonomous driving, drones, augmented reality, etc. [10]. Such a requirement can be fulflled by exploiting the physical proximity between the edge server and the client.
新型应用(如物联网IoT,增强和虚拟现实)导致数据产生量和网络传输的数据量指数级增长。为了减少响应时间,并且在接近用户和数据产生处处理大规模数据分析,研究人员提出了边缘云。正如名字所暗示的,边缘云是靠近终端用户的计算服务器集合,这些服务器具有有限的计算、存储和网络能力[1, 12, 22]。边缘云的中心目标是确保延迟关键型应用的低网络延迟(如自动驾驶、无人飞机、增强现实等[10])。这一需求可以通过利用边缘服务器和客户端的位置接近优势得以满足。
Existing studies focus on optimal utilization of the edge server by end-user requests, assuming that the server has been placed already [2, 18]. Little to no attention has been paid to model the edge server deployment problem along with its placement constraints. There are similarities between the edge server placement problem and replica server deployment problem in CDNs, for which several solutions exist in the literature [14, 15, 17]. Akin to CDN cache servers placement problem, edge server placement must also ensure consistent connectivity to end users while minimizing the cost of such a deployment. However, we argue that despite similarities in their objectives, the two placement problems are essentially quite different. Unlike replica servers, an edge server is more likely to cater to several compute requests of local relevance which does not require high volume data transfer over the network. In such a case, the availability and network latency associated with an edge server have greater priority over link usage and network bandwidth.
当前的研究关注通过终端用户请求优化边缘服务器的利用率,假设服务器已经部署完成[2, 18]。几乎没有研究关注建模边缘服务器部署问题以及放置约束条件。边缘服务器放置问题和CDN(内容分发网络)中的复制服务器部署问题有类似性; CDN(内容分发网络)中的复制服务器部署问题已经有多重解决方案,见文献[14, 15, 17]。类似于CDN缓存服务器部署问题,边缘服务器放置同样必须确保和终端用户的持续连接,同时最小化部署开销。然而,我们认为尽管两者目标有相似性,这两个放置问题在本质上是不同的。不同于复制服务器,边缘服务器是面向多个局部相关的计算请求,这些请求不需要大量经网络传输的数据。在这种情形下,与边缘服务器相关的可用性和网络延迟比链路使用量和网络带宽具有更高的优先级。
Several options for deploying edge servers have been proposed in the literature. Mobile Edge Clouds (MEC’s), defined by European Telecommunications Standards Institute (ETSI), aim to co-locate edge servers with cellular base stations set up by telecom providers operating in the area [1]. On the other hand, researchers have also proposed to utilize non-conventional compute resources, such as WiFi access points, smart speakers, network switches, etc., to support computation capability at the network edge [9]. Unlike MEC, these resources are owned and managed by end-users. Even though the proposed models differ in deployment requirements, management, capacities, etc.; we envision that the models are independent of the protocols, software stacks and user applications that will drive the edge cloud platform as a whole.
文献中提出多种部署边缘服务器的可能方案。移动边缘云(MEC)致力于将边缘服务器和蜂窝基站(由负责该地区运营的电信提供商建立)放置在一处[1],这一概念由欧洲电信标准化组织(ETSI)定义。另一方面,研究人员提出利用非传统计算资源(如WiFi访问点、智能音箱、网络交换机等)在网络边缘提供计算能力[9]。与MEC不同,这些资源由终端用户所拥有和管理。尽管提出的模型在部署需求、管理和能力等方面不同;我们预见这些模型独立于协议、软件栈和用户应用,促使边缘云平台成为一个整体。
In this paper, we present Anveshak, a deployment framework which enables edge service providers to select optimal sites for edge server placement. Our contributions are as follows. (1) Anveshak considers the availability and density of unmanaged edge resources in the area to steer the deployment location of a managed server. The novelty lies in predicting future deployments of user-owned edge servers and incorporating it in current edge server deployment problem. (2) We identify the areas of higher preference for deployment by observing the mobility pattern of the users in the area. We consider previous requests issued by the users to prioritize locations with a higher probability of edge service requests, thereby optimizing user satisfaction. (3) We extensively simulate Anveshak on real-world datasets collected over the city of Milan, Italy. Our evaluation shows that Anveshak increases the user request satisfaction by 67% while maintaining an average server utilization of 83%. To the best of our knowledge, there exist no previously known studies which consider server provisioning in a scenario where multiple edge cloud models coexist and operate in the same physical space.
本文中,我们展示了Anveshak,一种使得边缘服务提供商可以为边缘服务器放置选择最优站点的部署框架。我们的贡献如下:(1)Anveshak考虑本地未管理边缘资源的可用性和密度来引导受管理服务器的部署位置。创新性在于预测用户边缘服务器的未来部署,并集成到现有边缘服务器的部署问题中。(2)我们确定具有高优先权的部署位置,这是通过观察当地用户的移动模式。我们认为高优先位置用户提交的前期请求具备更高的服务请求可能性,因此优化用户满意度。(3)我们在真实数据集上深度仿真了Anveshak,数据集收集于意大利的米兰市。我们的评估表明Anveshak在保持83%的平均服务器利用率的同时将用户请求满足度提高了67%。就我们所知,没有前期工作在多个边缘云模型共存并在同一物理位置运维的场景下考虑服务器供给问题。
The rest of the paper is organized as follows. Section 2 discusses the physical edge cloud abstraction composing of multiple edge cloud models in same space. Section 3 provides an in-depth description of model, framework design and optimization problem of Anveshak. We implement Anveshak and evaluate its performance on real datasets in Section 4. Section 5 reviews the related work. We conclude our paper in Section 6.
本文的剩余部分组织如下:第二部分讨论在同一空间由多个边缘云模型组成的物理边缘云抽象;第三部分给出Anveshak模型、框架设计和优化问题的深度描述;第四部分描述Anveshak的实现和真实数据集上的性能评估;第5部分回顾相关工作;第6部分总结全文。
2 PHYSICAL EDGE CLOUD NETWORK (物理边缘云网络)
Researchers have proposed several edge cloud architectures to support the use-cases present in real world [2]. Mobile Edge Computing (MEC) is a telecommunication-vendor centric edge cloud model wherein the deployment, operation, and maintenance of edge servers is handled by an ISP operating in the area [10]. The model has garnered interest from standardization bodies [6]. On the other hand, researchers have proposed a user-centric view where a user can deploy computationally-capable network devices local to their surroundings. The proliferation of smart speakers, home automation hubs, intelligent wireless access points provides evidence to the adoption of such edge architectures [16]. Unlike the MEC resources, the user-centric edge resources are self-managing in nature and are less likely to have consistent network and computational availability.
研究人员已经提出多种边缘云架构,以支持真实世界的用户案例[2]。移动边缘计算(MEC)电信商为中心的边缘云模型;其中,边缘服务器的部署、操作和维护由本地ISP处理[10]。这种模型获得标准化组织的兴趣[6]。另一方面,研究人员也提出了用户为中心的观点;其中,用户可以在他们附近部署具有计算能力的网络设备。智能音箱、家庭自动化集线器和智能无线访问点等的普及为这种边缘架构的采用提供了证据[16]。不同于MEC资源,用户为中心的边缘资源是天然自管理的,并且具有更低可能来提供持续的网络和计算可用性。
Both above models consider different deployment options from in-network placement at aggregation level to opportunistic consolidation composed of small compute hubs. However, we consider a holistic view of a physical space where several edge servers belonging to different cloud models and technologies coexist. As each model brings in its advantages and drawbacks, the coexistence and cooperation between available edge servers will be critical to efficient computation and context availability in future. Figure 1 shows the physical abstraction of edge servers and users coexisting in a geographical area. The model is a two-tier hierarchy of edge servers in a physical space alongside with users, the details of which are explained below.
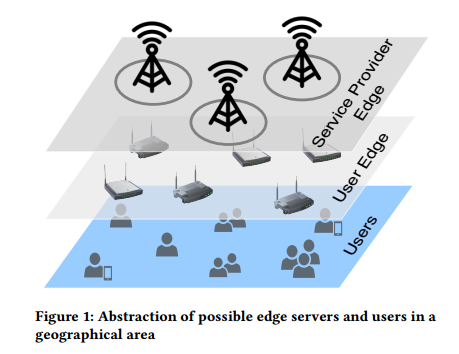
图1: 可能的位于同一地理区域的边缘服务器和用户抽象。
上述两种模型考虑不同的部署选项,从聚合级的网内放置到小计算集线器组成的机会合并。然而,我们考虑物理空间的全局视图;其中,多个属于不同云模型和技术的边缘服务器共存。由于每个模型具有自己的优劣势,可用边缘服务器的共存和协作是高效计算和未来上下文可用性的关键。图1展示了边缘服务器和用户在同一地理区域共存的物理抽象。该模型是两层层次化的,由物理空间的边缘服务器和用户组成;细节在下面的章节解释。
Users: The subscribers of edge cloud in a region act as the source for all compute requests. Previous research in user mobility has shown that user request distribution in any area is temporally and behaviorally influenced [11]. For example, user request density is more populated in city centers than suburban areas. Such request patterns profoundly affect the utilization of edge server deployments in any region. An efficient server deployment algorithm must consider the origin and pattern of user requests in a geographical region to allocate server resources for optimal utilization and availability.
用户:某一区域内边缘云的订阅者,作为所有计算请求的源。关于用户移动性的前期研究表明任意区域的用户请求分布是受时间和行为影响的[11]。例如,城市中心的用户请求密度远高于郊区。这种请求模式极大影响任意区域边缘服务器部署的利用率。一种高效的服务器部署算法必须考虑同一地理区域内用户请求的来源和模式,从而为最优化利用率和可用性分配服务器资源。
User-managed Edge: This layer is composed of edge servers which are managed by individual entities for local usage and are likely to be deployed in households, small workplaces, etc. These servers utilize WiFi (short-range) networks to interact with enduser. The user-managed edge servers are responsible for handling computational requests from a small set of clients and are thus limited in computation power. However, they provide a very local context to user-generated request. The availability of such servers is highly dependent on user residency and mobility itself. For example, densely-populated residential areas and tourist attraction spots have a higher availability of WiFi access points than in industrial/office areas [19].
用户控制的边缘:这一层由独立个体控制的边缘服务器组成,用于本地使用,并且可能部署于家庭、小型工作场所等。这些服务器使用WiFi(短距离)网络与终端用户交互。用户控制的边缘服务器负责处理来自少数客户端的计算请求,因此计算能力有限。然而,它们为用户请求提供本地上下文。这种服务器的可用性高度依赖于用户住所和移动性自身。例如,高密度居住区域和著名景区的WiFi访问点的可用性比工厂/办公区域的高的多。
Service Provider-managed Edge: The top-most layer of the edge server abstraction model is composed of service-provider managed edge servers. Such servers are co-located with cellular base stations set up in the region due to their strategic locations and constant ISP management. An edge server physically co-located at the base station signifcantly reduces the operation and maintenance costs involved for specifcally setting up a location to house a server. Unlike user-managed edge, the edge servers managed by a third-party service provider have a higher computational capability and wider-area coverage. These edge servers utilize the network fabric and capability offered by the cellular base station to connect with users and amongst themselves. ISPs can also remotely manage and maintain these edge servers by utilizing their existing set up infrastructure.
服务提供商控制的边缘:边缘服务器抽象的最上层由服务提供商控制的边缘服务器组成。这些服务器和这一区域建立的蜂窝基站的位置相同;这是因为他们的策略性位置和恒久性ISP管理。边缘服务器在物理上和基站的位置相同可以显著地降低操作和维护开销(特别是建立容纳一台服务器的位置)。与用户控制的边缘不同,第三方服务提供商控制的边缘服务器的计算能力更强,且区域覆盖范围更广。这些边缘服务器使用蜂窝基站提供的网络设施和能力连接用户,以及彼此互连。使用现有的基础设施,ISP可以远程管理和维护这些边缘服务器。
3 ANVESHAK: MODEL AND DESIGN (Anveshak:模型和设计)
The problem of deploying edge servers in a physical space boils down to ensuring low latency, proximity and high availability to clients. Further, installing a server at any location incurs a combination of CAPEX (purchase and deployment) and OPEX (maintenance, security) costs to the service provider. To maximize the profits, it is in best interests of the provider to select edge sites intelligently such that the deployed server has maximum impact and utilization. Anveshak enables service providers to find optimal edge sites in a large metropolitan area. It selects a prioritized list of cellular base stations within an area which can be augmented with an edge server. Through its insightful utilization of pre-existing user request patterns and edge servers in the area, Anveshak ensures that the selected edge site has maximum reachability and high user request satisfaction.
在物理空间部署边缘服务器的问题归结为保证到客户端的低延迟、位置接近和高可用性。此外,在任意位置部署服务器导致服务提供商CAPEX(购买和部署)和OPEX(维护、安全)组成成本开销。为了最大化收益,提供商智能选择边缘位置,使得部署的服务器具有最大的影响和利用率。Anveshak使得服务器提供商可以在大的城区区域内寻找最优边缘位置。它在某一区域内选择具有高优先权的蜂窝基站列表,这些蜂窝基站可以通过部署边缘服务器得到增强。通过本区域预存在的用户请求模式和边缘服务器利用率信息,Anveshak保证选择的边缘站点具有最大的可达性和用户请求满足度。
Figure 2 shows the workflow of Anveshak. We categorize the framework’s functioning in three phases, user mapping, user edge incorporation and edge location selection.
图2展示了Anveshak的工作流。我们将框架的功能分为3个阶段:用户映射、用户边缘集成和边缘位置选择。
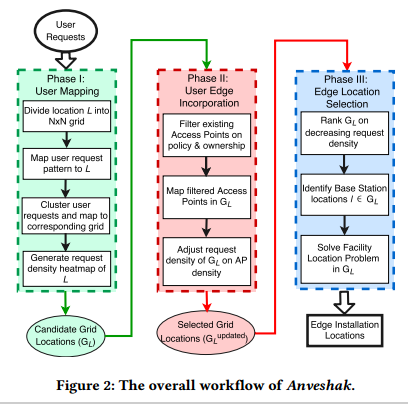
图2:Anveshak的总工作流。
Phase 1: User Mapping to Physical Space (阶段1: 用户映射到物理空间)
The design of Anveshak is based on the assumption that the edge service provider works in conjunction with the ISP to ensure optimal installation of edge servers on ISP-managed base stations. Therefore, the service provider will have access to the user request database from ISPs operating in the region. These request databases can include Call Detail Records (CDR), message requests, internet usages etc. which can be augmented to form user request pattern. Anveshak utilizes the dataset of communication requests by the clients of the ISP in its frst phase. The objective of the framework in this phase is to identify areas of high communication requests in the geographical region as these areas have a higher probability of receiving edge compute requests.
Anveshak的设计基于这一假设:边缘服务提供商与ISP协同工作来确保边缘服务器在ISP控制的基站的最优安置。因此,服务提供商需要访问本地ISP的用户请求数据库。这些请求数据库可能包含呼叫详细记录(CDR)、消息请求和因特网使用量等,其可以通过增强形成用户请求模式。Anveshak使用第一阶段内的ISP的客户端的通信请求数据集。框架在这一阶段的目标是识别本地理区域内具有高通信请求的区域,因为这些区域具有更高的接收边缘计算请求的可能。
Anveshak begins the phase by dividing the space S into evenly spaced square grids(shown in Figure 3a). Further, Anveshak maps the user communication request originating from a location in S, as shown in Figure 3b. The user requests are normalized and averaged over a time duration of one to several months such that temporal outliers in the dataset (user gatherings, fairs, concerts etc.) are ironed out. Once the framework has all user requests mapped to point set P in S, it clusters them based on inter-request distances and density. The clustering algorithm identifes regions with dense and frequent user requests in S by selecting a minimum number of request points within MinPts radii of an existing base station in that area. Further, the algorithm also specifes ϵ which defines the minimun required distance between two points to classify them as part of a single cluster. Figure 3c presents the user requests clustered together in S. The choice of ϵ and MinPts is key to efficient clustering in Anveshak and can be easily adjusted by the service provider to best suit deployment requirements.
Anveshak以将空间S划分为均等的二维空间网格开始(图3a所示)。此外,Anveshak映射来自S中某一位置的用户通信请求,如图3b所示。用户请求在从1到多个月的时间跨度内规格化和平均化,消除数据集(用户聚集,集市,音乐会等)中的时间异常值。一旦框架将用户请求映射到S中的点集P,依据请求间的距离和密度聚合它们。聚合算法识别S中区域的密度和频繁用户请求,这是通过选择本区域内现有基站的MinPts半径内的请求点的最小数字。此外,该算法指定ϵ参数,其定义两点间的最小要求距离,以将它们分类为单个聚合的一部分。图3c给出S中用户请求的聚类。ϵ的选择和MinPts的选择是Anveshak高效聚类的关键,并且可以由服务提供商轻易的改变以最佳适配部署要求。
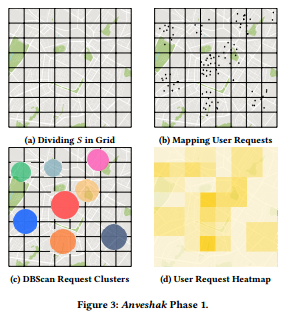
图3: Anveshak的阶段1。
Following request clustering, Anveshak maps arbitrary cluster shapes to the corresponding grids in S (shown in Figure 3d). The density of a cluster is normalized to generate grid-based heatmap of the region. In doing so, Anveshak can handle overlapping clusters, small dense clusters, and clusters of various shapes more efficiently than related approaches. Furthermore, this enables the framework to overcome the inefciencies of the clustering algorithm used.
请求聚类之后,Anveshak映射任意聚类形状到S中相应的网格(图3d所示)。聚类的密度规格化为生成本区域基于网格的热度图。为了实现这一目标,Anveshak可以比相关方法更高效地处理交叠聚类、低密度聚类和不同形状的聚类。此外,这使得框架可以克服使用的聚类算法的低效性。
The density heatmap and its location coordinates is fed into the next phase of Anveshak.
热度图的密度和位置坐标输入Anveshak的下一个阶段。
Phase 2: User Edge Incorporation (用户边缘合并)
As discussed in Section 2, compute-capable network devices such as smart speakers, home automation, smart WiFi routers, etc. have become quite popular and are expected to develop into $4.2 billion market by 2022 [16]. Such smart devices can resolve relatively small computations locally to the clients and will be preferred by users over a service provider-managed server in the same location. The availability of these devices signifcantly impacts the utilization of deployed edge server in an area as the number of user requests which will be offloaded to a managed edge server will notably reduce. In its second phase, Anveshak integrates the current and future availability of user-managed edge servers by the end users. It does so by building on the assumption that areas with high density of WiFi access points (APs) are more likely to have a future deployment of user-managed edge servers. The inclusion of this phase is key to the novelty of Anveshak over related works.
如第2部分讨论的,具备计算能力的网络设备(如智能音箱、家居自动化、智能WiFi路由等)已经变得相当普及,其到2022年市场期望规模将达到42亿美元[16]。这些智能设备可以分解局部于客户端的小的计算单元,且在同一位置用户更倾向于使用这些智能设备(相比于服务提供商管理的服务器)。这些设备的可用性显著影响某一区域部署的边缘服务器的利用率,因为用户请求的数量(将被卸载到管理的边缘服务器)将显著降低。在第二阶段,Anveshak将集成当前和未来的终端用户管理的边缘服务器的可用性。这通过建立下述假设实现:具备高WiFi访问点(APs)密度的区域具有更高的未来用户管理边缘服务器部署的可能。本阶段的内涵是Anveshak相较于其它相关工作的创新所在。
Anveshak merges all user requests from grid Gi ∈ S such that user requests in the same cluster C are distributed over several grid groups. It further exploits already existing datasets of WiFi APs in space S (such as Wigle [19]) and maps them on the same grid Gi. Based on the density of existing deployment, Anveshak revises the user request heatmap of S where grids with denser WiFi availability receives negative request density adjustment. The resulting map prioritizes locations with a lower number of local edge deployments as the probability of clients to request a provider-managed edge server is higher. The grid locations GL is fed into the next phase of Anveshak.
Anveshak归并来自网格Gi ∈ S的所有用户请求,使得同一集群C内的用户请求在多个网格组中分布。它进一步利用空间S中的现有WiFi AP数据集,并将它们映射到同一网格Gi。基于当前的部署密度,Anveshak修订S的用户请求热度图;具有更高WiFi可用性密度的网格收到负的请求密度调整。最终的映射给予具有更少本地边缘部署的位置高优先权,因为客户端请求提供商管理的边缘服务器的概率更高。网格位置GL输入到Anveshak的下一阶段。
Phase 3: Edge Location Selection (边缘位置选择)
In its fnal phase, Anveshak increasingly orders grids from Phase 2 on ratio of user request density. The set of users U within a grid Gi can be served by x possible edge locations (existing base stations) denoted by LGi = l1, . . . ,lx. Anveshak ensures one-hop connectivity between users and deployed server by selecting a location lk which is best reachable for majority of users in Gi. Let Rmax (u,Sl ) be the maximum tolerated network distance between U and Sl where l ∈ LGi .
最后一个阶段,Anveshak根据第二阶段中用户请求密度率递增排序网格。网格Gi中的用户集合U可以由x个可能的边缘位置(现有基站)提供服务,描述为LGi = l1, . . . ,lx。Anveshak保证用户和部署服务器之间的1跳连接,通过选择位置lk(对Gi中绝大部分用户具有最好的可达性)。以Rmax (u,Sl ) 表示U和Sl间最大容忍网络距离,这里 l ∈ LGi。

Based on the requirements and number of servers to be placed in S, Rmax of Sl will specify the cluster boundary for satisfying u and is influenced by the connectivity range of the existing base station. Further, let α denote the maximum cost incurred to access the server Sl by users in the cluster. Thus, the network cost (n(S,u)) of a cluster can denoted as
基于请求和放置到S中的服务器数量,Sl的Rmax指明满足u的集群边界,并受到现有基站的连接范围的影响。此外,以α表示集群中用户访问服务器Sl的最大开销。因为,集群的网络开销表示为:

In order to estimate the network costs between users and server location within a grid, the model utilizes a coordinate based network latency approximation technique [13]. Anveshak attempts to minimize the latency to one-hop between majority of users and deployed server Sl within grid Gi based on Equation 1. Further, the users in same grid which do not fall under direct connectivity of Sl are reachable within 2-3 hops by utilizing the internal network between base stations.
为了评估网格内用户和服务器位置的网络开销,模型使用基于坐标的网络延迟逼近技术[13]。Anveshak试图最小化网格Gi中大多数用户和已部署服务器Sl之间的延迟到1跳(基于公式1)。此外,同一网格内的在Sl中不具备直接连接的用户在2到3跳内可达(通过使用基站间的内部网络)。
Let xl denote a binary decision variable which is 1 if we locate Sl in candidate location l ∈ LGi . Therefore, the optimal server location for an arbitrary user u can be defned as,
以xl表示二进制变量,如果我们将Sl放置在候选位置l(l ∈ LGi),则其值为1。因此,任意用户u的最优服务器位置定义为:

The equation 3 is a variant of facility location problem (FLP) [7] with network capacity constraints. The resulting optimization is a well known NP-hard problem, the approximate solution of which can only be obtained by adding specifc placement constraints. However, since Anveshak divides S in small grids with limited number of edge site locations, even the worst-case iterative solution for optimizing Equation 3 takes reasonable time.
公式3是网络容量制约下设施选址问题(FLP)[7]的变种。最终的优化问题是众所周知的NP难问题,其近似解只能通过增加特定的放置约束获得。然而,由于Anveshak将S划分为具有有限边缘站点位置的小网格,即使是最坏情形下的优化公式3的迭代解决方案只消耗合理的时间。
4 EVALUATION METHODOLOGY (评测方法)
We now evaluate the efficiency of Anveshak in placing edge servers over Milan, Italy by utilizing several open datasets. We frst implement Anveshak’s workflow (shown in Figure 2) as two separate pluggable modules. The Phase 1 of the framework is implemented as clustering module in R. The module produces clusters of user requests based on request patterns, WiFi access points, and base stations datasets provided to it. We design the module to be independent of the choice of clustering algorithm used and can be freely selected by the service provider (default is DBScan). Phase 2 and 3 of Anveshak are implemented in Python and return base station coordinates to the service provider considering the constraints imposed.
我们现在评估Anveshak在意大利米兰放置边缘服务器的效率,该评测使用多个开放数据集。我们首先实现Anveshak的工作流(如图2所示)为两个分立的可插拔模块。框架的第1阶段实现为R中的聚类模块。该模块基于请求模式、WiFi访问点和提供的基站数据集产生用户请求的聚类。我们设计该模块使其独立于聚类算法的选择(服务提供商可以使用和自由选择,默认为DBScan)。Anveshak第二阶段和第三阶段使用python实现,并返回考虑制约条件的基站坐标给服务提供商。
We compare Anveshak with two alternative placement approaches which have been discussed in the literature [14, 17]. The approaches are described as follows:
我们比较了Anveshak和两种可选的放置方法(在文献[14, 17]中讨论)。这两种方法描述如下:
- Greedy: This method allocates average user request densities to the base stations in the area of interest. It then utilizes a greedy selection algorithm to select top-k base stations which serve most number of users in the area.
- 贪心:该方法分配平均用户请求密度给兴趣区域的基站。然后,它使用贪心选择算法选择服务本区域大部分用户数量的前k个基站。
- Random: As its name suggests, this approach randomly chooses k base stations on the map and assigns edge servers to them.
- 随机:如名字所暗示的,这种方法随机选择地图中k个基站,并将边缘服务器分配给它们。
Unlike Anveshak, both of the approaches mentioned above neither consider whether selected base stations serve the same set of users due to connectivity overlap nor the availability of other edge servers in the area.
与Anveshak不同,上述提到的这两种方法既不考虑所选择的基站是否服务相同的用户集合(由于连接交叠)也不考虑区域内其它边缘服务器的可用性。
4.1 Dataset (数据集)
In order to gauge the impact of selection algorithm on real networks, we utilize several open datasets over city of Milan, Italy. For user connectivity requests, we use the dataset published by Telecom Italia from November 1st to December 31st 2013. The anonymized dataset divides the map of Milan into 100x100 grids of 250m width. The dataset contains user’s internet connection to base station as user request tied to its grid ID along with the time when it was made. In our evaluation, Anveshak utilizes the average total user requests in November, 2013 to generate clusters of user requests. The heatmap of unclustered user internet requests for November is shown in Figure 4a.
为了测量选择算法在真实网络上的影响,我们使用意大利米兰市的多个开放数据集。对于用户连接请求,我们采用意大利电信发布的2013年11月1日到12月31日的数据集。该匿名数据集将米兰地图划分为250米宽的100x100网格。数据集包含用户到基站的因特网连接(用户请求关联其网格ID,以及请求的时间)。评估中,Anveshak使用2013年11月份的平均总用户请求生成用户请求集群。11月份未聚类的用户因特网请求热度图如图4a所示。
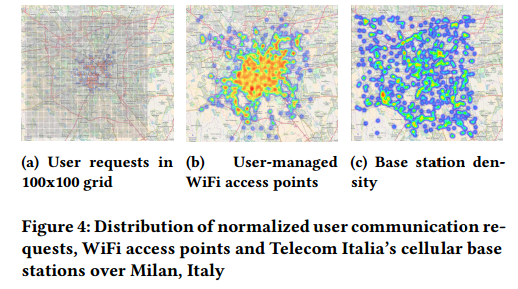
图4: 规格化用户通信请求、WiFi访问点和意大利电信蜂窝基站的分布(意大利米兰市)。
We map all WiFi access points in the same area of that of Telecom Italia dataset by utilizing open crowd-sourced dataset from Wigle [19]. The dataset contains SSID, location coordinates, signal strength, channel number etc. for all access points. Out of the entire dataset, we flter out the hotspot access points to reduce variations in access point location density. Figure 4b shows the density heatmap of WiFi access points in Milan. We utilize an open dataset of all cellular base stations in the world and use the ones in Milan using the coordinates provided in the dataset. We further filter and use close to 800+ Telecom Italia base stations in Milan in our evaluation. The heatmap of Telecom Italia base stations in Milan is shown in Figure 4c.
我们映射意大利电信数据集中的同一区域的WiFi访问点,使用来自Wigle[19]的开发人群源数据集。该数据集包含所有访问点的SSID,位置坐标,信号强度,通道数量等。我们从整个数据集中过滤出热点访问点,以减少访问点位置密度的变化。图4b给出米兰WiFi访问点的密度热度图。我们使用全球所有蜂窝基站的开放数据集,并使用数据集中提供的坐标采用米兰的蜂窝基站。我们进一步过滤并使用接近800+个米兰的意大利电信基站。意大利电信的米兰基站热度图如图4c所示。
As assumed in design of Anveshak, we can observe from Figure 4 that both user requests and WiFi access points are concentrated in populated areas of the city (such as city center) whereas the cellular base stations are evenly distributed throughout the map.
如Anveshak设计中的假设,我们从图4中观察到:用户请求和WiFi访问点聚集于城市的聚集区域(如城市中心),而蜂窝基站在真个地图中均匀分布。
4.2 Results (结果)
We now evaluate the placement efciency of the discussed approaches. We task the placement algorithms to select 50 out of total 812 base stations in Milan as edge server deployment sites. The average coverage radius of base station in the dataset is little higher than 1000m; we utilize a coordinate based latency approximation [13] to estimate user requests which can be satisfed within this area. These requests may originate from neighboring grids of the selected base station. Further, Anveshak utilizes users internet traffc requests for November 2013 for initial clustering and edge site selection. We then evaluate the efciency of the selection for user requests in December 2013.
现在,我们评估上述讨论的放置方法的效率。我们的放置算法是从总共812个米兰基站中选择50个作为边缘服务器的部署站点。数据集中基站的平均覆盖基站稍大于1000米;我们使用基于坐标的延迟近似[13]来评估本区域可满足的用户请求。这些请求可能源自选择基站的邻接网格。此外,Anveshak使用2013年11月用户因特网流量请求初始化聚类和边缘站点选择。然后,我们评估2013年12月用户请求的选择效率。
We focus our evaluation and comparison on two metrics: (1) the percentage of user requests satisfed by selected edge site, and (2) the total utilization of the deployed edge server. All our results are averaged over ten runs.
我们关注和比较两种指标:(1)选择站点满足的用户请求百分比,和(2)部署的边缘服务器的总利用率。所有的结果是10次运行的平均值。
User Request Satisfaction: Figure 5 compares the percentage of user requests which were satisfed by the base stations selected by each approach for every third day in December. As observed from the figure, edge servers deployed via Anveshak can serve ≈ 67% more users than Greedy in an area. We attribute this behavior to greedy selection of sites based on user requests inherent to Greedy functioning. Even though the site selection by Greedy prefers highest serving base stations, it often fails to consider locations which are far away from densely populated areas yet having signifcant request origination. On careful analysis, we found that unlike Anveshak which satisfes all clusters on the map, Greedy favors base stations within most dense user cluster.
用户请求满足度:图5比较了每种方法选择的基站满足的用户请求的百分比(12月的每3天)。由图可知,Anveshak方案部署的边缘服务器可以比贪心算法服务更多的用户,约高67%。我们将这一行为归因于贪心选择的站点基于用户请求固有的贪心功能。即使贪心站点选择倾向于最高级服务基站,也通常无法考虑远离聚集区域的位置(但有显著的请求根源)。通过仔细分析,我们发现不同于Anveshak满足地图中所有集群的行为,贪心倾向于具有最高用户集群密度的基站。
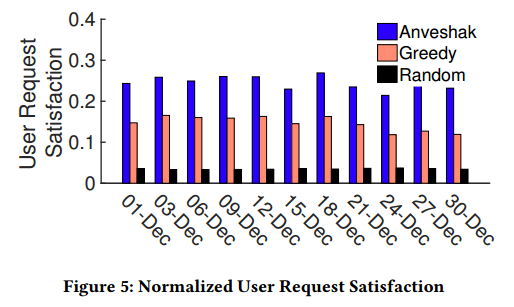
图5:规格化用户请求满意度
From the results, we also see that Anveshak satisfes ≈ 25% of total user requests on average by selecting 8% of total base stations. In our further experiments, we found that Anveshak achieves more than 90% user satisfaction by installing just 124 edge servers (on average). Whereas Greedy and Random require 218 and 300+ servers respectively. We do not show the detailed results due to space limitations.
从结果中,我们还可以发现,Anveshak通过选择8%的基站可以平均满足约25%的用户请求。在我们进一步的实验中,我们发现Anveshak取得高达90%的用户满意度,通过安装124个边缘服务器(平均)。然而,贪心和随机算法分别要求218和300+服务器。由于篇幅限制,我们不再展示详细的结果。
Server Utilization: We deploy edge servers on all selected locations where a server can handle up to 500 user requests every 10 minutes. Further, we augment 10% WiFi APs in the coverage area as compute-capable and a single AP handle 50 requests/10mins within the grid thereby operating at 10% compute power of that of a managed edge server. As discussed in Section 2 user-managed edge server first handles all user requests upon exceeding which it is sent to base station edge server. If the base stations receive more requests than its capacity in 10 minutes, it offloads additional requests to the remote cloud. Figure 6 shows overall server utilization in December 2013.
服务器利用率:我们将边缘服务器部署到所有选择的位置;这里,一台服务器每分钟可以处理高达500个用户请求。此外,我们增强覆盖区域内10%的WiFi AP作为具备计算能力的设备,并且网格内单个AP可以处理50个请求/10分钟,因此其具备控制的边缘服务器的10%的计算能力。如第二部分讨论的,用户控制的边缘服务器首先处理所有的用户请求,超过其处理能力时,将用户请求发送到基站边缘服务器。如果基站在10分钟内接收到超过其处理容量的请求,其将请求卸载到远程云。图6给出2013年12月整体服务器利用率。
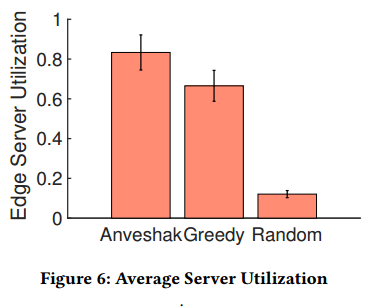
图6: 平均服务器利用率。
Anveshak achieves 83% server utilization on average whereas Greedy and Random achieve 66% and 12% utilization only. We attribute the reason for such high utilization by Anveshak to its selection of edge servers with less availability of user-managed edge servers. The sites selected by Greedy have a high concentration of WiFi APs which leads to lesser requests sent to the managed server.
Anveshak平均取得83%的服务器利用率,而贪心和随机算法只取得66%和12%的平均利用率。我们将Anveshak的如此高的利用率的原因归因为其选择的边缘服务器具有更少用户控制边缘服务器的可用性。贪心算法选择的站点的WiFi AP的集中性高,导致更少的请求被发送到控制的服务器。