基于echarts的3D地图进行,直接将这代码粘贴到echarts的demo中即可呈现效果
var mygeo = { // 标准的geojson格式
  "type": "FeatureCollection",
  "features": [
        {
       "type":"Feature",
          "properties":{
              "name": "myself1"
          },
          "geometry":{
            "type":"MultiPolygon",
            "coordinates": [
                [
                  [[37, -109.05],[41, -109.03],[41, -102.05],[37, -102.04]], // outer ring
                  [[37.29, -108.58],[40.71, -108.58],[40.71, -102.50],[37.29, -102.50]] // hole
                ]
            ]
          }
        },
        {
       "type":"Feature",
          "properties":{
              "name": "myself2"
          },
          "geometry":{
            "type":"Polygon",
            "coordinates": [
                  [[41, -109.03],[41, -102.05],[43, -102.04],[43, -109.03]]
            ]
          }
        }
    ]
};
echarts.registerMap('mygeo', mygeo);
var regions = mygeo.features.map(function (feature) {
    console.log(JSON.stringify(feature));
    return {
        name: feature.properties.name,
        value: Math.random(),
        height: Math.random()*10
    };
});
myChart.setOption({
    visualMap: {
        show: false,
        min: 0.4,
        max: 1,
        inRange: {
            color: ['#313695', '#4575b4', '#74add1', '#abd9e9', '#e0f3f8', '#ffffbf', '#fee090', '#fdae61', '#f46d43', '#d73027', '#a50026']
        }
    },
    series: [{
        type: 'map3D',
        map: 'mygeo',
        data: regions
    }]
});
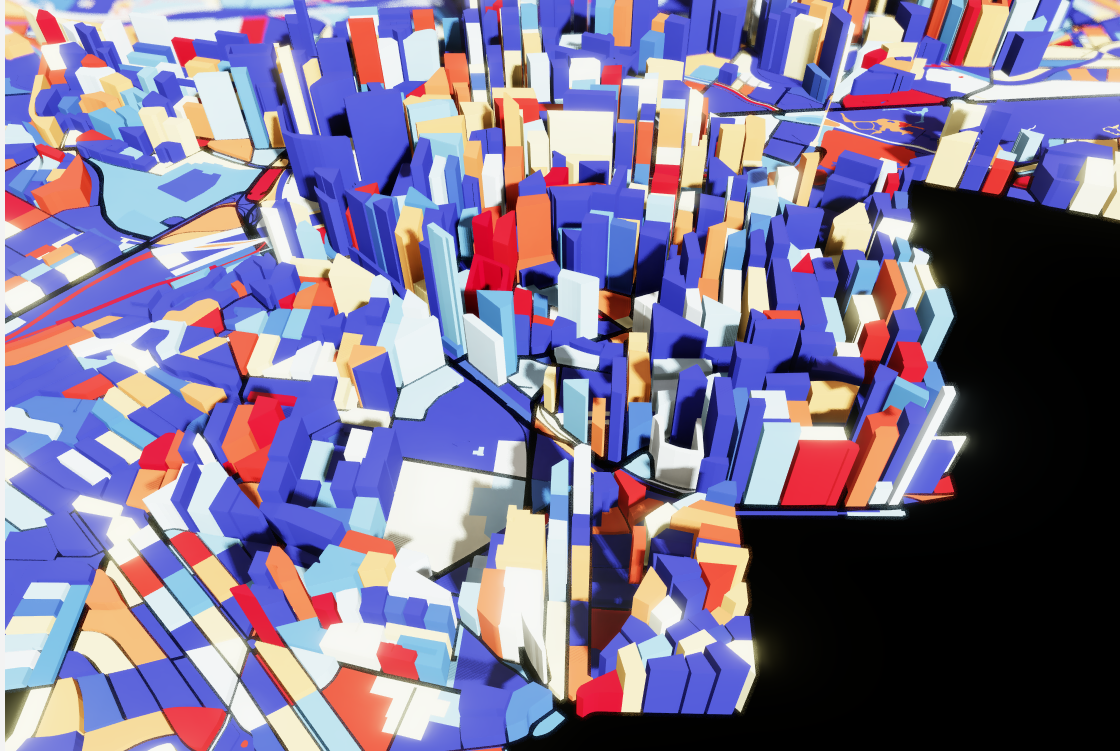
效果图:

参考地址:https://echarts.apache.org/examples/zh/editor.html?c=map3d-buildings&gl=1
参考地址对应的效果: