rect 函数用来在一张图上添加矩形,只需要指定左下角和右上角的坐标的位置,就可以画出一个矩形
基本用法:
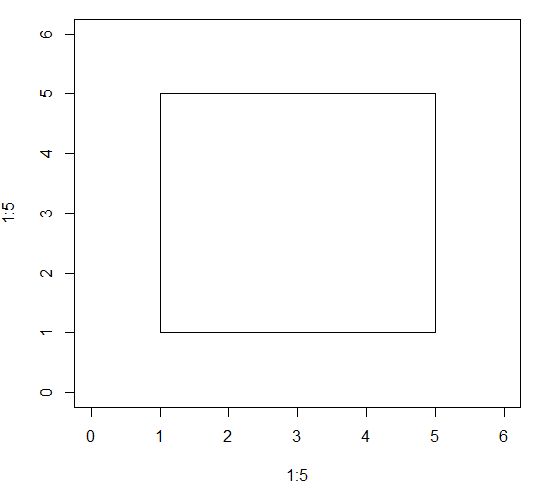
plot(1:5, 1:5, xlim = c(0,6), ylim = c (0,6), type = "n")
rect(xleft = 1, ybottom = 1, xright = 5, ytop = 5)
效果图如下:
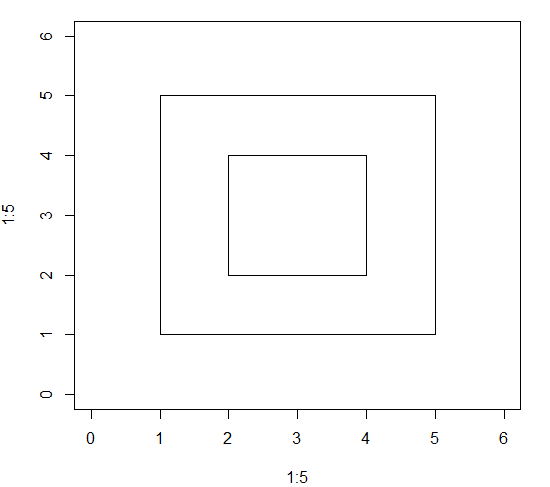
xleft, ybottom, xright, ytop 支持一次设置多个值,同时创建多个矩形,用法如下:
plot(1:5, 1:5, xlim = c(0,6), ylim = c (0,6), type = "n")
rect(xleft = c(1, 2), ybottom = c(1, 2), xright = c(5, 4), ytop = c(5, 4))
效果图如下:
参数设置:
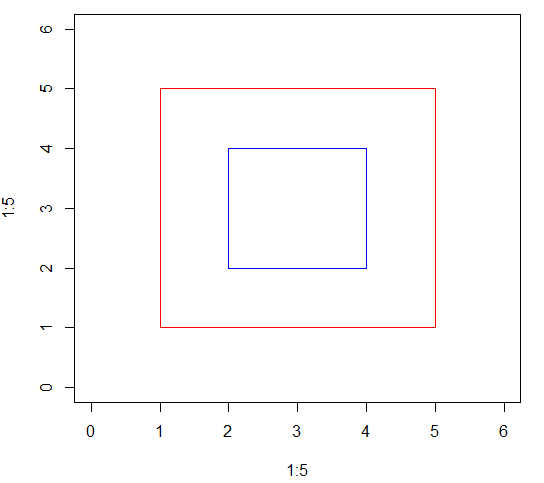
border : 设置矩形边框的颜色,默认为"black", 支持为多个矩形设置不同的值
代码示例:
plot(1:5, 1:5, xlim = c(0,6), ylim = c (0,6), type = "n")
rect(xleft = c(1, 2), ybottom = c(1, 2), xright = c(5, 4), ytop = c(5, 4), border = c("red", "blue"))
效果图如下:
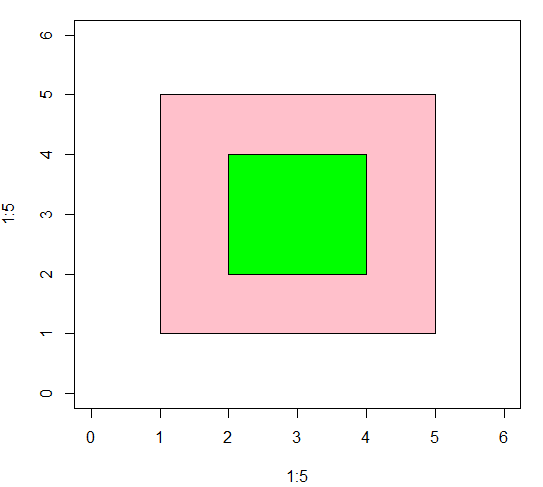
col : 设置矩形的填充色,默认为NULL, 表示无填充色,, 支持为多个矩形设置不同的值
plot(1:5, 1:5, xlim = c(0,6), ylim = c (0,6), type = "n")
rect(xleft = c(1, 2), ybottom = c(1, 2), xright = c(5, 4), ytop = c(5, 4), col = c("pink", "green"))
效果图如下:
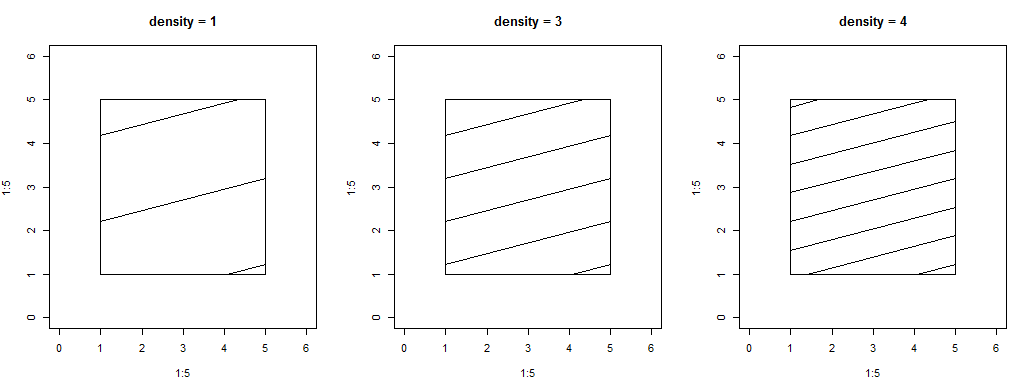
density 和 angle : 搭配使用,设置用线条填充矩形,angle 设置线条的角度,默认为45, density 设置填充线条的密度,数值越大越密集
代码示例:
par(mfrow = c(1,3))
plot(1:5, 1:5, xlim = c(0,6), ylim = c (0,6), type = "n", main = "density = 1")
rect(xleft = 1, ybottom = 1, xright = 5, ytop = 5, angle = 45, density = 1)
plot(1:5, 1:5, xlim = c(0,6), ylim = c (0,6), type = "n", main = "density = 3")
rect(xleft = 1, ybottom = 1, xright = 5, ytop = 5, angle = 45, density = 2)
plot(1:5, 1:5, xlim = c(0,6), ylim = c (0,6), type = "n", main = "density = 4")
rect(xleft = 1, ybottom = 1, xright = 5, ytop = 5, angle = 45, density = 3)
效果图如下:
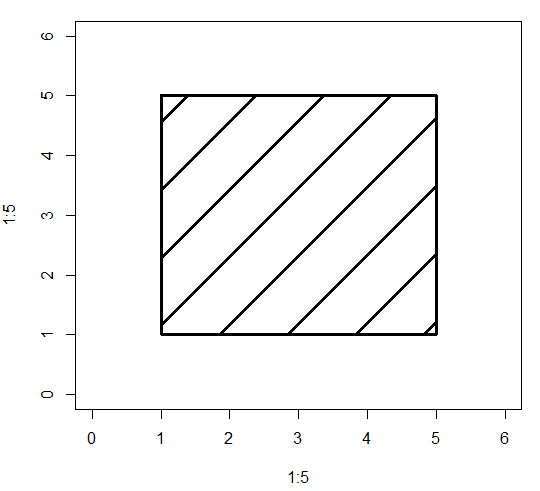
lwd: 设置矩形所有线条的宽度
代码示例:
plot(1:5, 1:5, xlim = c(0,6), ylim = c (0,6), type = "n")
rect(xleft = 1, ybottom = 1, xright = 5, ytop = 5, angle = 45, density = 2, lwd = 3)
效果图如下:
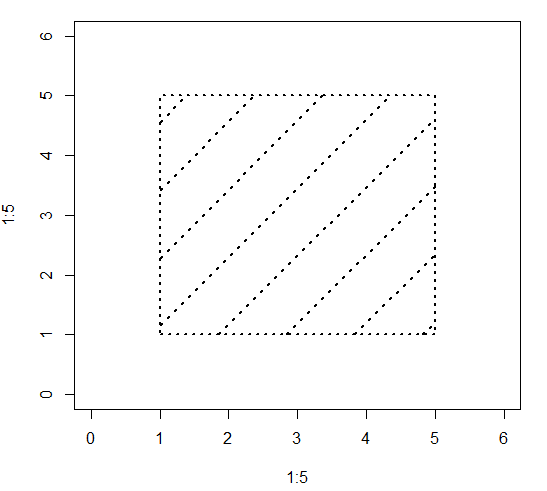
lty: 设置矩形所有线条的类型
代码示例:
plot(1:5, 1:5, xlim = c(0,6), ylim = c (0,6), type = "n")
rect(xleft = 1, ybottom = 1, xright = 5, ytop = 5, angle = 45, density = 2, lwd = 2, lty = 3)
效果图如下: