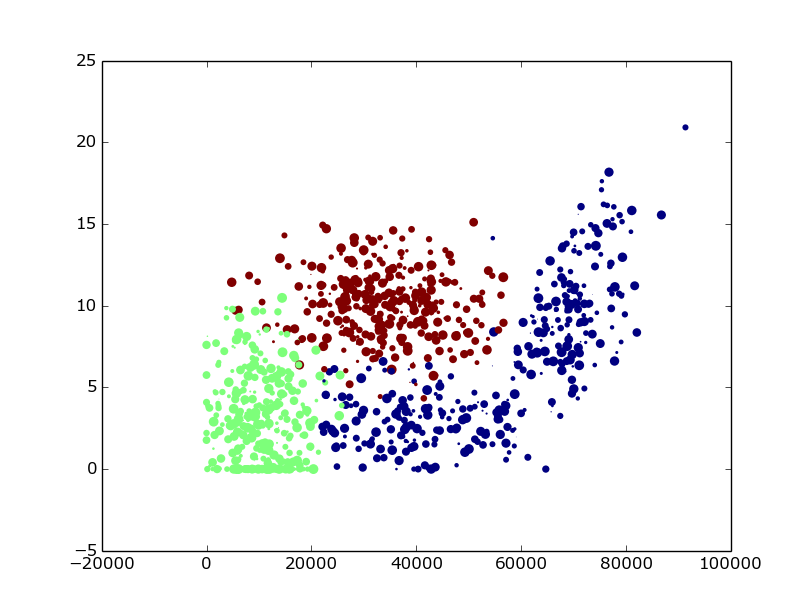
ax.scatter(datingDataMat[:,0],datingDataMat[:,1],s=30*datingDataMat[:,2],c=50.0*array(datingLabels),edgecolors='none')
原始数据:
40920 8.326976 0.953952 3
14488 7.153469 1.673904 2
26052 1.441871 0.805124 1
75136 13.147394 0.428964 1
38344 1.669788 0.134296 1
72993 10.141740 1.032955 1
35948 6.830792 1.213192 3
42666 13.276369 0.543880 3
67497 8.631577 0.749278 1
35483 12.273169 1.508053 3
50242 3.723498 0.831917 1
63275 8.385879 1.669485 1
5569 4.875435 0.728658 2
51052 4.680098 0.625224 1
......