-
prometheus 官网
https://prometheus.io/docs/introduction/overview/ -
GrafanaLabs 官网
https://grafana.com/ -
SpringBoot使用Prometheus
Maven 因springboot中已经集成了actuator 数据
org.springframework.boot
spring-boot-starter-actuator
io.micrometer
micrometer-registry-prometheus
1.1.3
-
springboot 配置文件 yml
management:
security:
enabled: false
#prometheus+grafana+springboot2监控集成配置
metrics:
export:
prometheus:
enabled: true
jmx:
enabled: true
endpoints:
web:
exposure:
include: '*'
base-path: /metrics
#prometheus+grafana+springboot2监控集成配置 -
Application 中添加 bean
@Bean
MeterRegistryCustomizerconfigurer(
@Value("${spring.application.name}") String applicationName) {
return (registry) -> registry.config().commonTags("application",applicationName);
} -
启动application 访问 http://localhost:8080/metrics/prometheus
以上为 springboot 启动 prometheus 发布信息
7.以windows环境 启动prometheus
prometheus.exe --config.file=prometheus.yml --web.listen-address=:8091 &
8.GrafanaLabs 直接执行,
9.登录Grafana localhost:3000 默认端口
-
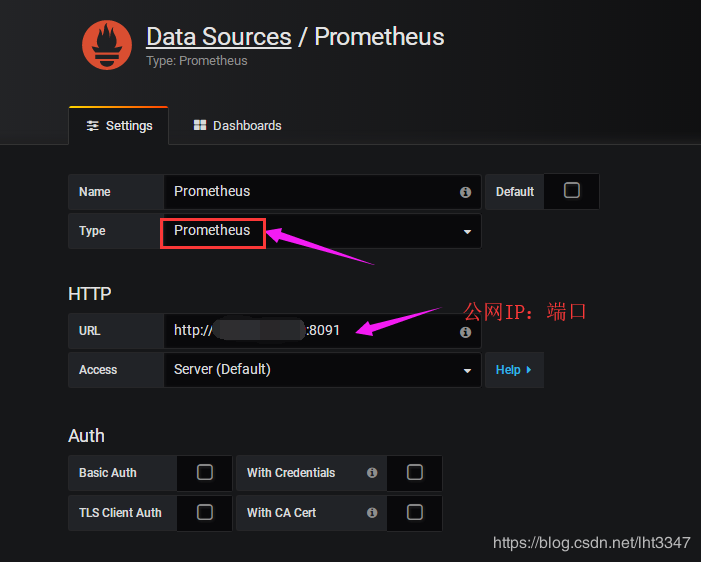
添加prometheus数据源
2、选择监控仪表盘模板导入。
访问地址:https://grafana.com/dashboards ---> serch框输入windows ----> 选择心仪模板 (注意模板所支持的数据源为prometheus) ----- 进行 ID 或者JOSN文件两种方式导入。 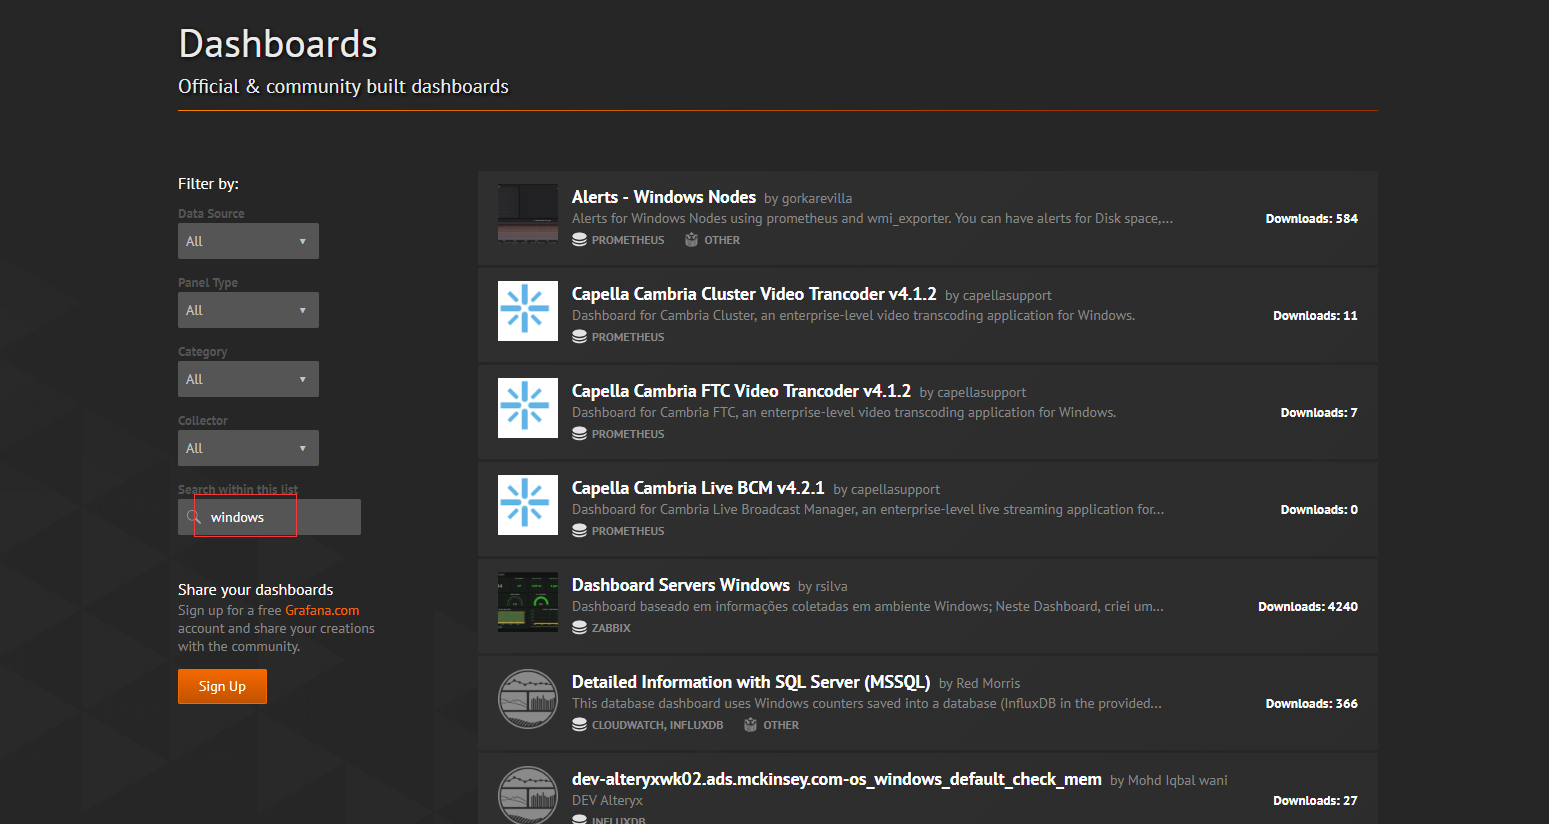 windows 模版 可以使用6564 ID 模版 jvm 模版可使用 4701 ID号
Alerting Grafana 预警配置管理
在alerting 中 添加 Natification channels 属性 点击绿色按钮 New channels
新增email 修改 邮件 信息
[smtp]
;enabled = true
;host = smtp.qq.com:25
;user =1261574841@qq.com
;password =ft*****chg ##发送验证码
;skip_verify = true
;from_address =1261574841@qq.com
;from_name = Grafana
    可以增加webHook 会触发 指定接口信息

使用 small 中 可以使用列表 webhook  发布  kafka