ROS入门笔记(四):ROS实践(小海龟仿真)— ROS Topics
1 基础知识
1.1 运行ROS Master所在主机的资源地址
1.2 ROS常用命令
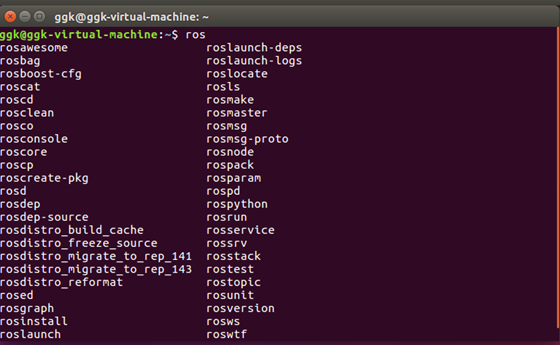
1.2.1 查看所有以ros开头的命令
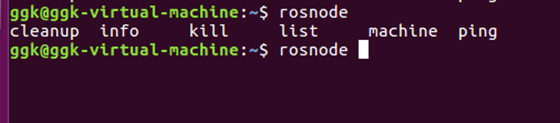
1.2.2 命令的快捷方式
1.3 重要命令
2 ROS Topics
2.1 使用rqt_graph
2.2 rostopic
2.2.1 rostopic echo
2.2.2 rostopic list
2.3 ROS Messages
2.3.1 rostopic type
2.3.2 rostopic pub
2.3.3 rostopic hz
3 rqt_plot
4 rqt_plot出现的问题(kinetic)
4.1 问题
4.2 原因
4.3 解决方法
4.4 deb文件安装方法
1 基础知识
1.1 运行ROS Master所在主机的资源地址
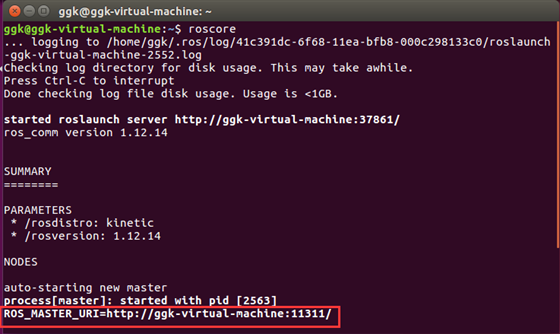
ROS是分布式的软件框架,ROS Master可能分布在某一台主机上,ROS Master在整个系统中只能存在一个,其他的很多主机必须要知道当前的ROS Master在什么位置。
- 退出ROS Master:
Ctrl C
1.2 ROS常用命令
|
命令 |
作用 |
|
catkincreatepkg |
创建功能包 |
|
rospack |
获取功能包的信息 |
|
catkin_make |
编译工作空间中的功能包 |
|
rosdep |
自动安装功能包依赖的其他包 |
|
roscd |
功能包目录跳转 |
|
roscp |
拷贝功能包中的文件 |
|
rosed |
编辑功能包中的文件 |
|
rosrun |
运行功能包中的可执行文件 |
|
roslaunch |
运行启动文件 |
1.2.1 查看所有以ros开头的命令
- 在终端中输入ros,按Tab键
1.2.2 命令的快捷方式
- rosnode的使用方法?
rosnode+空格+按下Tab键 # 查看rosnode支持的配置参数
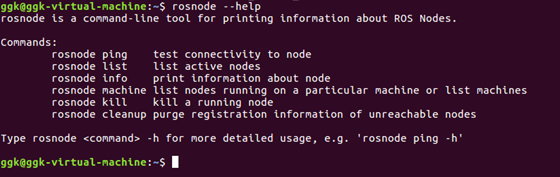
- rosnode帮助信息:
rosnode --help
1.3 重要命令
1)查看当前系统当中存在的节点,终端输入:
$ rosnode list

2)查看某一具体节点的具体信息,终端输入:
rosnode info /
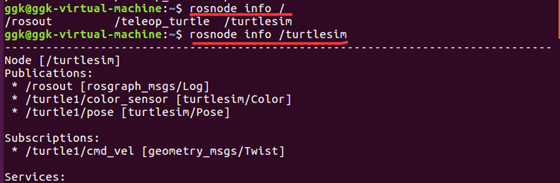
2 ROS Topics
- turtlesim_node节点和turtle_teleop_key节点之间是通过一个ROS话题来互相通信的。
- turtle_teleop_key在一个话题上发布按键输入消息,而turtlesim则订阅该话题以接收该消息。下面让我们使用rqt_graph来显示当前运行的节点和话题。
2.1 使用rqt_graph
rqt_graph能够创建一个显示当前系统运行情况的动态图形。rqt_graph是rqt程序包中的一部分。
方法:新打开一个终端,输入以下命令:(前提:必须保证小海龟三步走步骤开启)
$ rqt_graph
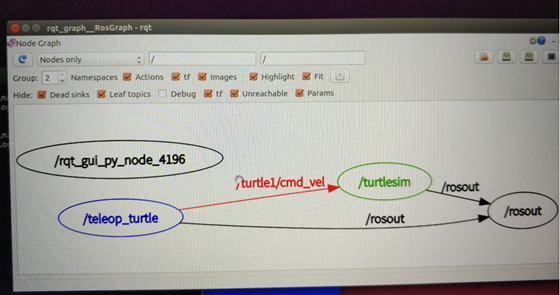
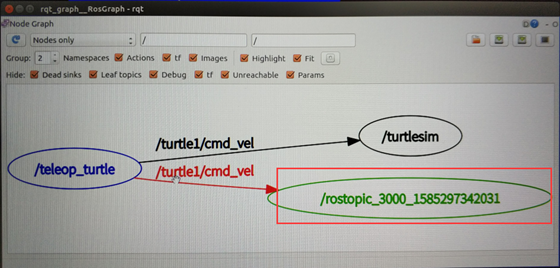
- 鼠标放在/turtle1/command_velocity上方,相应的ROS节点(蓝色和绿色)和话题(红色)就会高亮显示。
- turtlesim_node和turtle_teleop_key节点正通过一个名为 /turtle1/cmd_vel的话题来互相通信。
2.2 rostopic
rostopic命令工具能让你获取有关ROS话题的信息。
$ rostopic -help # 使用帮助选项查看rostopic的子命令
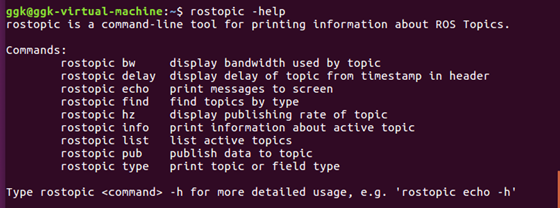
rostopic is a command-line tool for printing information about ROS Topics.

Commands:
    rostopic bw     display bandwidth used by topic
    rostopic delay    display delay of topic from timestamp in header
    rostopic echo    print messages to screen
    rostopic find    find topics by type
    rostopic hz     display publishing rate of topic
    rostopic info    print information about active topic
    rostopic list    list active topics
    rostopic pub    publish data to topic
    rostopic type    print topic or field type

Type rostopic <command> -h for more detailed usage, e.g. 'rostopic echo -h'
2.2.1 rostopic echo
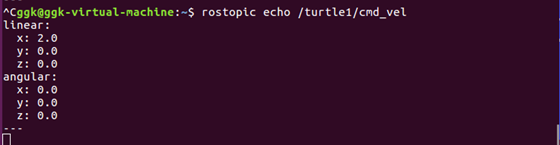
rostopic echo可以显示在某个话题上发布的数据。
1)查看echo子命令需要的参数
$ rostopic echo -h
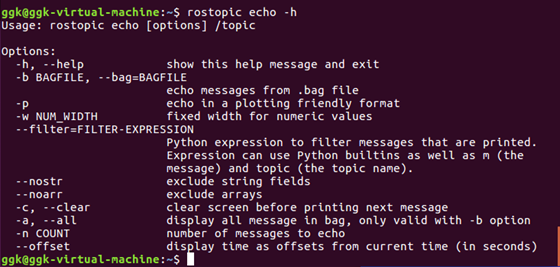
Usage: rostopic echo [options] /topic

Options:
-h, --help show this help message and exit
-b BAGFILE, --bag=BAGFILE
echo messages from .bag file
-p echo in a plotting friendly format
-w NUM_WIDTH fixed width for numeric values
--filter=FILTER-EXPRESSION
Python expression to filter messages that are printed.
Expression can use Python builtins as well as m (the
message) and topic (the topic name).
--nostr exclude string fields
--noarr exclude arrays
-c, --clear clear screen before printing next message
-a, --all display all message in bag, only valid with -b option
-n COUNT number of messages to echo
--offset display time as offsets from current time (in seconds)
2)用法
$ rostopic echo [topic] # 监听某一话题的具体内容
$ rostopic echo /turtle1/cmd_vel

# 一个新终端中看一下turtle_teleop_key节点在/turtle1/cmd_vel话题上发布的数据
- 你可能看不到任何东西因为现在还没有数据发布到该话题上。接下来我们通过按下方向键使turtle_teleop_key节点发布数据。
- 记住如果turtle没有动起来的话就需要你重新选中turtle_teleop_key节点运行时所在的终端窗口。
现在再看一下rqt_graph(需要刷新一下ROS graph)。正如你所看到的,rostopic echo(绿色显示部分)现在也订阅了/turtle1/cmd_vel话题。
2.2.2 rostopic list
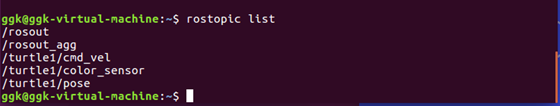
1)rostopic list能够列出所有当前订阅和发布的话题。
$ rostopic list #列出所有当前订阅和发布的话题
2)查看list子命令需要的参数
$ rostopic list -h # 查看帮助信息
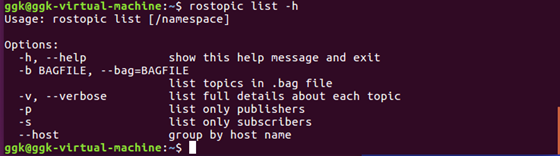
Usage: rostopic list [/namespace]

Options:
-h, --help show this help message and exit
-b BAGFILE, --bag=BAGFILE
list topics in .bag file
-v, --verbose list full details about each topic
-p list only publishers
-s list only subscribers
--host group by host name
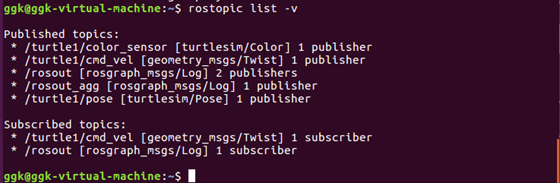
3)在rostopic list中使用verbose选项
$ rostopic list -v # 显示出有关所发布和订阅的话题及其类型的详细信息
2.3 ROS Messages
话题之间的通信是通过在节点之间发送ROS消息实现的。对于发布器(turtle_teleop_key)和订阅器(turtulesim_node)之间的通信,发布器和订阅器之间必须发送和接收相同类型的消息。这意味着话题的类型是由发布在它上面的消息类型决定的。使用rostopic type命令可以查看发布在某个话题上的消息类型。
2.3.1 rostopic type
rostopic type #查看所发布话题的消息类型。
1)用法
rostopic type [topic]
2)例子
$ rostopic type /turtle1/cmd_vel
看到:
geometry_msgs/Twist

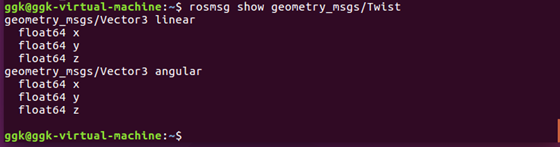
3)rosmsg命令来查看消息的详细情况
$ rosmsg show geometry_msgs/Twist
知道了turtlesim节点所期望的消息类型,接下来我们就可以给turtle发布命令了。
2.3.2 rostopic pub
rostopic pub可以把数据发布到当前某个正在广播的话题上。
1)用法
rostopic pub [topic] [msg_type] [args]
2)示例
$ rostopic pub -1 /turtle1/cmd_vel geometry_msgs/Twist -- '[2.0, 0.0, 0.0]' '[0.0, 0.0, 1.8]'

# 以上命令会发送一条消息给turtlesim,告诉它以2.0大小的线速度和1.8大小的角速度开始移动。
这是一个非常复杂的例子,因此让我们来详细分析一下其中的每一个参数。
rostopic pub # 这条命令将会发布消息到某个给定的话题。
-1 #(单个破折号)这个参数选项使rostopic发布一条消息后马上退出。
/turtle1/cmd_vel # 这是消息所发布到的话题名称。
geometry_msgs/Twist # 这是所发布消息的类型。
--
#(双破折号)这会告诉命令选项解析器接下来的参数部分都不是命令选项。这在参数里面包含有破折号-(比如负号)时是必须要添加的。
'[2.0, 0.0, 0.0]' '[0.0, 0.0, 1.8]'
# 在一个geometry_msgs/Twist消息里面包含有两个浮点型元素:linear和angular。
# 在本例中,2.0是linear的值,1.8是angular的值。这些参数其实是按照YAML语法格式编写的,这在YAML文档中有更多的描述。
- 目前turtle已经停止移动了。因为turtle需要一个稳定的频率为1Hz的命令流来保持移动状态。
- 使用rostopic pub -r命令来发布一个稳定的命令流。
$ rostopic pub /turtle1/cmd_vel geometry_msgs/Twist -r 1 -- '[2.0, 0.0, 0.0]' '[0.0, 0.0, 1.8]'
# 以1Hz的频率发布速度命令到速度话题上。

2.3.3 rostopic hz
rostopic hz # 查看数据发布的频率。
1)用法
rostopic hz [topic]
2)例子
$ rostopic hz /turtle1/pose # 查看turtlesim_node发布/turtle/pose时有多快
- turtlesim正以大约62Hz的频率发布数据给turtle。

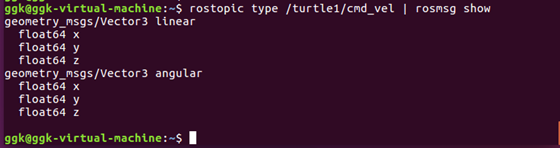
- 结合rostopic type和rosmsg show命令来获取关于某个话题的更深层次的信息
rostopic type /turtle1/cmd_vel | rosmsg show
3 rqt_plot
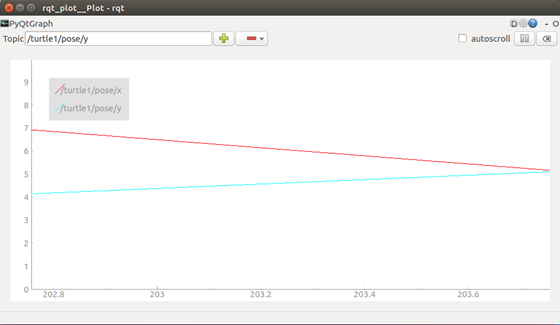
- rqt_plot命令可以实时显示一个发布到某个话题上的数据变化图形。这里我们将使用rqt_plot命令来绘制正在发布到/turtle1/pose话题上的数据变化图形。
- 首先,在一个新终端中运行rqt_plot命令:
$ rosrun rqt_plot rqt_plot
- 会弹出一个新窗口,在窗口左上角的一个文本框里你可以添加需要绘制的话题。在里面输入/turtle1/pose/x后然后点击 "+" 再输入/turtle1/pose/y,点击 "+"。
- 现在你会在图形中看到turtle的x-y位置坐标图。
- 按下减号按钮会显示一组菜单让你隐藏图形中指定的话题。
- http://wiki.ros.org/rqt_plot
4 rqt_plot出现的问题(kinetic)
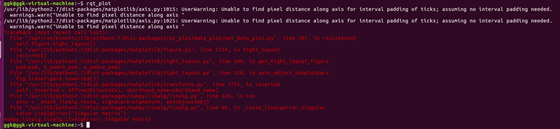
4.1 问题
ggk@ggk-virtual-machine:~$ rosrun rqt_plot rqt_plot
/usr/lib/python2.7/dist-packages/matplotlib/axis.py:1015: UserWarning: Unable to find pixel distance along axis for interval padding of ticks; assuming no interval padding needed.
warnings.warn("Unable to find pixel distance along axis "
/usr/lib/python2.7/dist-packages/matplotlib/axis.py:1025: UserWarning: Unable to find pixel distance along axis for interval padding of ticks; assuming no interval padding needed.
warnings.warn("Unable to find pixel distance along axis "
Traceback (most recent call last):
File "/opt/ros/kinetic/lib/python2.7/dist-packages/rqt_plot/data_plot/mat_data_plot.py", line 107, in resizeEvent
self.figure.tight_layout()
File "/usr/lib/python2.7/dist-packages/matplotlib/figure.py", line 1754, in tight_layout
rect=rect)
File "/usr/lib/python2.7/dist-packages/matplotlib/tight_layout.py", line 349, in get_tight_layout_figure
pad=pad, h_pad=h_pad, w_pad=w_pad)
File "/usr/lib/python2.7/dist-packages/matplotlib/tight_layout.py", line 128, in auto_adjust_subplotpars
fig.transFigure.inverted())
File "/usr/lib/python2.7/dist-packages/matplotlib/transforms.py", line 1775, in inverted
self._inverted = Affine2D(inv(mtx), shorthand_name=shorthand_name)
File "/usr/lib/python2.7/dist-packages/numpy/linalg/linalg.py", line 526, in inv
ainv = _umath_linalg.inv(a, signature=signature, extobj=extobj)
File "/usr/lib/python2.7/dist-packages/numpy/linalg/linalg.py", line 90, in _raise_linalgerror_singular
raise LinAlgError("Singular matrix")
numpy.linalg.linalg.LinAlgError: Singular matrix
4.2 原因
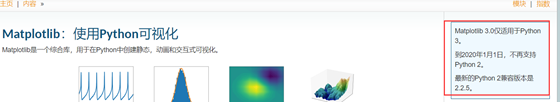
我们可以登录Matplotlib官网发现,kinetic中的python2.7和Matplotlib不兼容,并且不再支持Python2。
因此,我们需要寻找另一个可视化工具,PyQtGraph。
4.3 解决方法
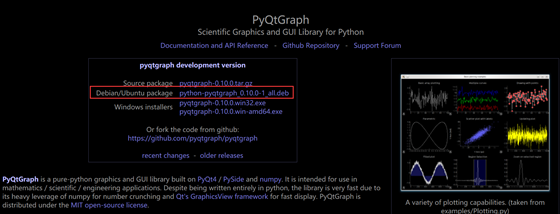
- 安装PyQtGraph
- 官网:http://www.pyqtgraph.org/
- 我们下载之后安装就可以了。
4.4 deb文件安装方法
Ubuntu中deb文件详细安装方法:
1.首先打开电脑主界面。
2.然后找到"安装包"后双击。
3.最后点击"安装"键进行安装即可。
1)步骤1
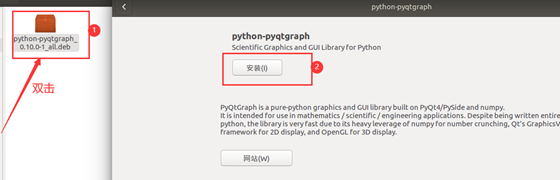
2)步骤2

微信公众号:喵哥解说
公众号介绍:主要研究机器学习、计算机视觉、深度学习、ROS等相关内容,分享学习过程中的学习笔记和心得!期待您的关注,欢迎一起学习交流进步!同时还有1200G的Python视频和书籍资料等你领取!!!