canvas 入门之作:
三步实现一个时钟:
直接上效果:
- step 1 : 背景制作
首先制作从1-12的数字:
    var canvas = document.getElementById('canvas');
    var ctx = canvas.getContext('2d');
    canvas.width = canvas.height = 400;
    ctx.translate(200,200);
    var R = 150;
    ctx.font = "14px Helvetica";
    ctx.textAlign = 'center';
    ctx.textBaseline = 'middle';
    for(var i=1;i<13;i++){
        var radian = (i*30)*Math.PI / 180;
        ctx.fillText(i,R*Math.sin(radian),R*(-Math.cos(radian)))
    }
关于 js 中Math.cos()和 Math.sin()的作用是这样的:Math.sin(x) x 的正玄值。返回值在 -1.0 到 1.0 之间; Math.cos(x) x 的余弦值。返回的是 -1.0 到 1.0 之间的数; 这两个函数中的X 都是指的“弧度”而非“角度”,弧度的计算公式为: 2*PI/360*角度; 30° 角度 的弧度 = 2*PI/360*30;
效果图如下: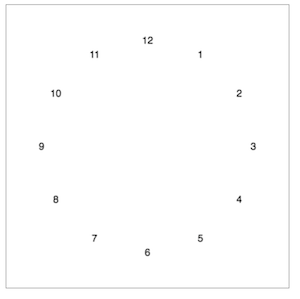
十分简单的绘出了背景; - step 2 : 绘出当前时间的指针位置
因为秒针的颜色与时针,分针的不同,所以才用了 ctx.beginPath()多次;
var getTime = function(){
        var myDate =  new Date();
        return {
            H:myDate.getHours(),      //获取当前小时数(0-23)
             M:myDate.getMinutes(),    //获取当前分钟数(0-59)
             S:myDate.getSeconds(),    //获取当前秒数(0-59)
        }
    }

    var sDeg = 6*Math.PI / 180;
    var dDeg = 30*Math.PI /180;

    var Animation = function(time){
        ctx.strokeStyle = "#e20437";
        ctx.moveTo(0,0);
        ctx.lineTo(140*Math.sin(sDeg*time.S),140*(-Math.cos(sDeg*time.S)))
        ctx.lineWidth = 2;
        ctx.lineCap = 'round';
        ctx.stroke();
        ctx.beginPath();
        ctx.lineWidth = 2;
        ctx.strokeStyle = "#000";
        ctx.moveTo(0,0);
        ctx.lineTo(100*Math.sin(sDeg*time.M),100*(-Math.cos(sDeg*time.M)));
        ctx.stroke();
        ctx.beginPath();
        ctx.lineWidth = 3;
        ctx.moveTo(0,0);
        ctx.lineTo(80*Math.sin(dDeg*time.H),80*(-Math.cos(dDeg*time.H)));
        ctx.stroke();
    }
    var time = getTime();
    Animation(time);
效果图:
- step 3 :添加动画
给 canvas添加动画:var Animation = function(time){ ctx.clearRect(-200,-200,400,400); printBG(); ctx.strokeStyle = "#e20437"; ctx.moveTo(0,0); ctx.lineTo(140*Math.sin(sDeg*time.S),140*(-Math.cos(sDeg*time.S))) ctx.lineWidth = 2; ctx.lineCap = 'round'; ctx.stroke(); ctx.beginPath(); ctx.lineWidth = 2; ctx.strokeStyle = "#000"; ctx.moveTo(0,0); ctx.lineTo(100*Math.sin(sDeg*time.M),100*(-Math.cos(sDeg*time.M))); ctx.stroke(); ctx.beginPath(); ctx.lineWidth = 3; ctx.moveTo(0,0); ctx.lineTo(80*Math.sin(dDeg*time.H),80*(-Math.cos(dDeg*time.H))); ctx.stroke(); }; var time = getTime(); Animation(time); setInterval(function(){ time.S += 1; if(time.S>60){ time = getTime(); } Animation(time); },1000)
为什么我会每60秒就获取一次时间呢?因为 setInterval 有一个众所周知的缺点,在时间计算方面随着时间的推移,会因为阻塞等等原因失去准确率,所以我这样做可以提高时间的准确,当然使用 webwork 应该也能解决问题;
其实在实现的过程中,大家都发现了连背景也要重新绘制,效率真的非常差,这正是原生 API 的不足之处,这个可以使用一些框架来进行解决;
另一种方法是,专门制作一个背景将两者重叠在一起;还有一个 api 是也可以解决这个问题的就是:ctx.clip(),这是可以在 canvas里扣下一部分画面,只在这里面绘图,不过碰到动画和背景相接触的就没有办法了,局限性比较大完整的代码我都放在了 GitHub 里:https://github.com/Grewer/JsDemo/tree/master/clock
demo 地址:https://grewer.github.io/JsDemo/clock/step3.html