继上一篇http://www.cnblogs.com/EasonJim/p/7613595.html介绍了断路器之后,其实它还提供了一个管理页面来监控这些应用的调用数据。
首先,我是基于上一个例子ZooKeeper实现的服务注册与发现:http://www.cnblogs.com/EasonJim/p/7613734.html
然后不知道是不是ZK的问题,而不是使用Eureka的问题,导致访问/hystrix.stream时一致报错:Unable to connect to Command Metric Stream,此方法在网上没能找到解决方案。
如果是以Eureka来搭建的,集成很简单,只要在服务消费者上引入依赖即可
POM:
        <dependency>
            <groupId>org.springframework.boot</groupId>
            <artifactId>spring-boot-starter-actuator</artifactId>
        </dependency>

        <dependency>
            <groupId>org.springframework.cloud</groupId>
            <artifactId>spring-cloud-starter-hystrix-dashboard</artifactId>
        </dependency>
        <dependency>
            <groupId>org.springframework.cloud</groupId>
            <artifactId>spring-cloud-starter-hystrix</artifactId>
        </dependency>
然后在main方法入口的Class上加入以下注解:
@EnableCircuitBreaker
@EnableHystrix
@EnableHystrixDashboard
最后访问/hystrix
输入地址和Title
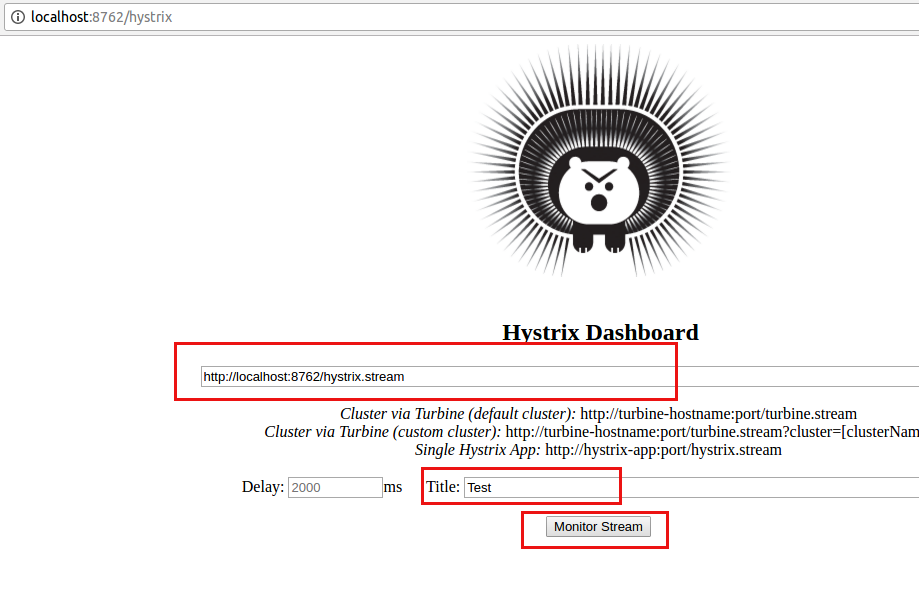
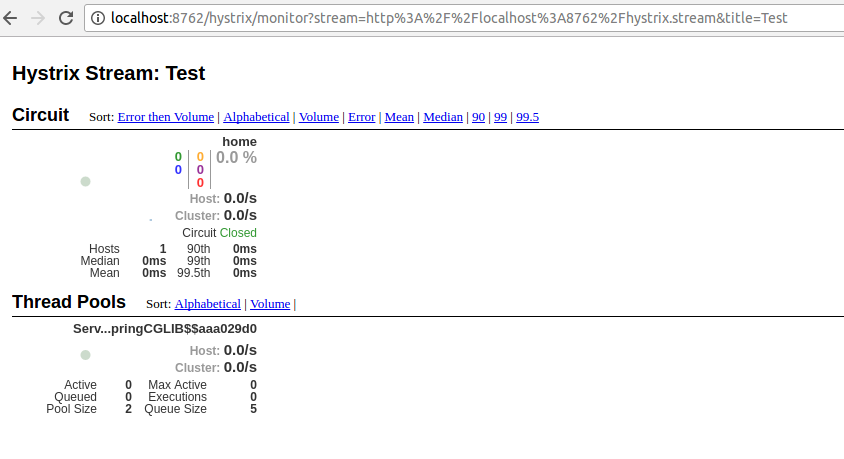
即可看见监控的数据:
参考: