环境准备:
角色划分:
系统:CentOS 7

es主节点/es数据节点/kibana/head                 192.168.0.128

es主节点/es数据节点/logstash                    192.168.0.129

es主节点/es数据节点/filebeat                    192.168.0.130
全部关闭防火墙和selinux:
systemctl stop firewalld && systemctl disable firewalld

sed -i 's/=enforcing/=disabled/g' /etc/selinux/config  && setenforce 0
全部配置系统环境:
#vim /etc/security/limits.conf

baoshan soft memlock unlimited
baoshan hard memlock unlimited
* soft nofile 65536
* hard nofile 131072
* soft nproc 2048
* hard nproc 4096
root soft nofile 65535
root hard nofile 65535

#vim /etc/sysctl.conf

vm.swappiness=0
vm.max_map_count=655360
vm.swappiness = 0
全部安装Java环境:
# mkdir /software && cd /software               #所有安装包目录
#wget https://software-hc.oss-cn-beijing.aliyuncs.com/java.tar.gz
# tar zxf java.tar.gz && mv java /usr/local/jdk

# vim /etc/profile        #配置java环境变量

JAVA_HOME=/usr/local/jdk
PATH=$PATH:$JAVA_HOME/bin:$JAVA_HOME/jre/bin
CLASSPATH=.:$JAVA_HOME/lib/dt.jar:$JAVA_HOME/lib/tools.jar:$JAVA_HOME/jre/lib
export JAVA_HOME PATH CLASSPATH

# source !$

# java -version

# ln -s /usr/local/jdk/bin/java /usr/local/bin/java
安装head插件:
因为head插件是用node.js开发的,所以需要此环境.
# wget https://software-hc.oss-cn-beijing.aliyuncs.com/node-v10.15.3-linux-x64.tar.xz
# tar -Jxf node-v10.15.3-linux-x64.tar.xz && mv node-v10.15.3-linux-x64/ /usr/local/node
# vim /etc/profile
export NODE_HOME=/usr/local/node
export PATH=$NODE_HOME/bin:$PATH
export NODE_PATH=$NODE_HOME/lib/node_modules:$PATH
# source /etc/profile
# node -v
安装head插件:
# wget https://software-hc.oss-cn-beijing.aliyuncs.com/master.zip

# unzip master.zip && mv elasticsearch-head-master/ /usr/local/elasticsearch-head

# cd /usr/local/elasticsearch-head

# npm install -g cnpm --registry=https://registry.npm.taobao.org

# cnpm install -g grunt-cli

# cnpm install -g grunt

# cnpm install grunt-contrib-clean

# cnpm install grunt-contrib-concat

# cnpm install grunt-contrib-watch

# cnpm install grunt-contrib-connect

# cnpm install grunt-contrib-copy

# cnpm install grunt-contrib-jasmine                #若报错就再执行一遍
修改head的Gruntfile.js。
# vim /usr/local/elasticsearch-head/Gruntfile.js

#找到下面connect属性,新增 hostname: '0.0.0.0',

                connect: {
                        server: {
                                options: {
                                        hostname: '0.0.0.0',            #不要忘了后面的逗号
                                        port: 9100,
                                        base: '.',
                                        keepalive: true
                                }
                        }
                }
后台启动grunt server:
# cd /usr/local/elasticsearch-head

# nohup grunt server &

# eval "cd /usr/local/elasticsearch-head/ ; nohup  npm run start >/dev/null 2>&1 & "
配置head启动脚本:
# vim /usr/bin/elasticsearch-head

#!/bin/bash
#chkconfig: 2345 55 24
#description: elasticsearch-head service manager

data="cd /usr/local/elasticsearch-head/ ; nohup  npm run start >/dev/null 2>&1 &   "
START() {
                eval $data
}

STOP() {
                ps -ef | grep grunt | grep -v "grep" | awk '{print $2}' | xargs kill -s 9 >/dev/null
}


case "$1" in
  start)
        START
        ;;
  stop)
        STOP
        ;;
  restart)
        STOP
        sleep 2
        START
        ;;
  *)
        echo "Usage: elasticsearch-head (|start|stop|restart)"
        ;;
esac

# chmod +x /usr/bin/elasticsearch-head
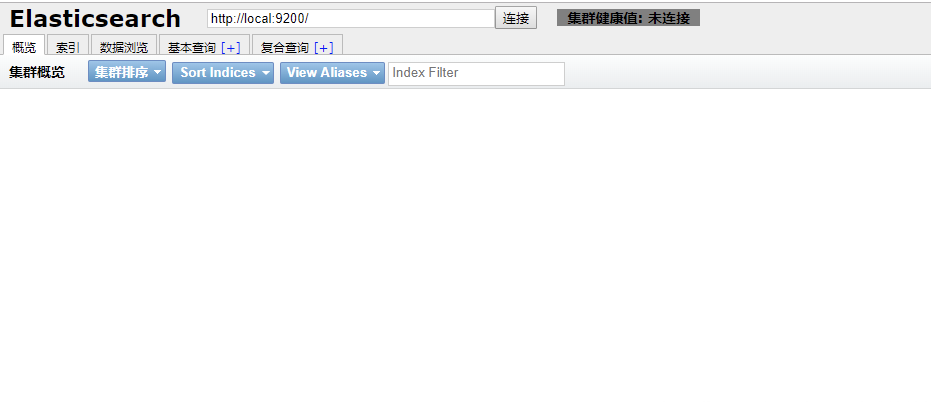
测试head是否可以访问
访问路径  http://内网ip/公网ip:9100
例子:http://192.168.1.128:9100
ps:因为没有安装es集群,所有应该是没有数据的
elasticsearch
全部节点创建用户:
# useradd elk
全部节点安装elasticsearch
# wget https://software-hc.oss-cn-beijing.aliyuncs.com/elasticsearch-6.7.1.tar.gz

# cd /software

# tar zxf elasticsearch-6.7.1.tar.gz && mv elasticsearch-6.7.1 /usr/local/elasticsearch

# mkdir /usr/local/elasticsearch/data      ###创建data数据目录

# chown -R elk:elk /usr/local/elasticsearch
全部节点配置文件:我们这里三天主机均可以成为master并且都存储数据
192.168.0.128:
# vim /usr/local/elasticsearch/config/elasticsearch.yml

cluster.name: elk               #集群名,同一集群必须相同
node.name: elk-128              #指定节点主机名
node.master: true               #允许成为主节点,如为flase不参加选举不成为主节点
node.ingest: flase         #主要是针对海量请求的时候可以进行负载均衡,用于预处理数据(索引和搜索阶段都可以用到)。
node.data: true                 #成为数据节点,如为flase不成为数据节点
path.data: /usr/local/elasticsearch/data                #数据存放路径
path.logs: /usr/local/elasticsearch/logs                #日志路径
bootstrap.memory_lock: false                #关闭锁定内存,设置为true会报错
network.host: 192.168.0.128                #监听ip
http.port: 9200                 #http端口
transport.tcp.port: 9300
discovery.zen.ping.unicast.hosts: ["192.168.0.128", "192.168.0.129", "192.168.0.130"]                #初始主机列表
discovery.zen.minimum_master_nodes: 2               # n/2+1
http.enabled: true                  #使用http协议对外提供服务
http.cors.enabled: true             #允许head插件访问es
http.cors.allow-origin: "*"
192.168.0.129:
# vim /usr/local/elasticsearch/config/elasticsearch.yml

cluster.name: elk               #集群名,同一集群必须相同
node.name: elk-129              #指定节点主机名
node.master: true               #允许成为主节点,如为flase不参加选举不成为主节点
node.ingest: flase         #主要是针对海量请求的时候可以进行负载均衡,用于预处理数据(索引和搜索阶段都可以用到)。
node.data: true                 #成为数据节点,如为flase不成为数据节点
path.data: /usr/local/elasticsearch/data                #数据存放路径
path.logs: /usr/local/elasticsearch/logs                #日志路径
bootstrap.memory_lock: false                #关闭锁定内存,设置为true会报错
network.host: 192.168.0.129                #监听ip
http.port: 9200                 #http端口
transport.tcp.port: 9300
discovery.zen.ping.unicast.hosts: ["192.168.0.128", "192.168.0.129", "192.168.0.130"]                #初始主机列表
discovery.zen.minimum_master_nodes: 2               # n/2+1
http.enabled: true                  #使用http协议对外提供服务
http.cors.enabled: true             #允许head插件访问es
http.cors.allow-origin: "*"
192.168.0.130:
# vim /usr/local/elasticsearch/config/elasticsearch.yml

cluster.name: elk               #集群名,同一集群必须相同
node.name: elk-130              #指定节点主机名
node.master: true               #允许成为主节点,如为flase不参加选举不成为主节点
node.ingest: flase         #主要是针对海量请求的时候可以进行负载均衡,用于预处理数据(索引和搜索阶段都可以用到)。
node.data: true                 #成为数据节点,如为flase不成为数据节点
path.data: /usr/local/elasticsearch/data                #数据存放路径
path.logs: /usr/local/elasticsearch/logs                #日志路径
bootstrap.memory_lock: false                #关闭锁定内存,设置为true会报错
network.host: 192.168.0.130                #监听ip
http.port: 9200                 #http端口
transport.tcp.port: 9300
discovery.zen.ping.unicast.hosts: ["192.168.0.128", "192.168.0.129", "192.168.0.130"]                #初始主机列表
discovery.zen.minimum_master_nodes: 2               # n/2+1 n代表的是master数量,本次为3台master,3/2+1余数向上取==2
http.enabled: true                  #使用http协议对外提供服务
http.cors.enabled: true             #允许head插件访问es
http.cors.allow-origin: "*"
全部启动elasticsearch:
# su - elk -c "/usr/local/elasticsearch/bin/elasticsearch -d"

# tail -f /usr/local/elasticsearch/logs/elk.log                 #查看日志,是否正常启动
查看集群状态:
[root@elk-128 software]# curl '192.168.0.128:9200/_cluster/health?pretty'
{
"cluster_name" : "elk",
"status" : "green", ###当前集群状态绿色表示健康
"timed_out" : false,
"number_of_nodes" : 3, ##节点个数
"number_of_data_nodes" : 3, ##数据节点个数
"active_primary_shards" : 0,
"active_shards" : 0,
"relocating_shards" : 0,
"initializing_shards" : 0,
"unassigned_shards" : 0,
"delayed_unassigned_shards" : 0,
"number_of_pending_tasks" : 0,
"number_of_in_flight_fetch" : 0,
"task_max_waiting_in_queue_millis" : 0,
"active_shards_percent_as_number" : 100.0
}
[root@elk-128 software]#

# curl '192.168.0.129:9200/_cluster/health?pretty'
# curl '192.168.0.130:9200/_cluster/health?pretty' #返回结果与上面一致
查看当前master节点:
# curl '192.168.0.130:9200/_cat/master?v'
id                     host           ip             node
iytvSXOIRIKBwYMAKd6EAg 192.168.0.129 192.168.0.129 elk-129

# curl '192.168.0.129:9200/_cat/master?v'

# curl '192.168.0.128:9200/_cat/master?v'                  #返回结果与上面一致

ps:当129挂掉后,会从其他两台机器中选举一台为master,然后curl命令出来的就是新的master信息。
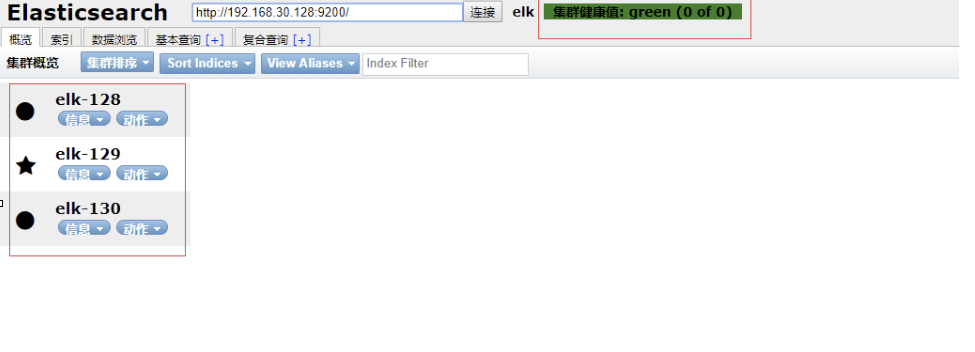
访问head查看集群状态:
http://192.168.0.128:9100
配置elasticsearch服务:
服务配置文件

# vim /etc/sysconfig/elasticsearch
1
################################
# Elasticsearch
################################

# Elasticsearch home directory
#ES_HOME=/usr/share/elasticsearch
ES_HOME=/usr/local/elasticsearch

# Elasticsearch Java path
#JAVA_HOME=
JAVA_HOME=/usr/local/jdk
CLASSPATH=.:$JAVA_HOME/lib/dt.jar:$JAVA_HOME/lib/tools.jar:$JAVA_HOME/jre/lib

# Elasticsearch configuration directory
#ES_PATH_CONF=/etc/elasticsearch
ES_PATH_CONF=/usr/local/elasticsearch/config

# Elasticsearch PID directory
#PID_DIR=/var/run/elasticsearch
PID_DIR=/usr/local/elasticsearch/run

# Additional Java OPTS
#ES_JAVA_OPTS=

# Configure restart on package upgrade (true, every other setting will lead to not restarting)
#RESTART_ON_UPGRADE=true

################################
# Elasticsearch service
################################

# SysV init.d
#
# The number of seconds to wait before checking if Elasticsearch started successfully as a daemon process
ES_STARTUP_SLEEP_TIME=5

################################
# System properties
################################

# Specifies the maximum file descriptor number that can be opened by this process
# When using Systemd, this setting is ignored and the LimitNOFILE defined in
# /usr/lib/systemd/system/elasticsearch.service takes precedence
#MAX_OPEN_FILES=65535

# The maximum number of bytes of memory that may be locked into RAM
# Set to "unlimited" if you use the 'bootstrap.memory_lock: true' option
# in elasticsearch.yml.
# When using systemd, LimitMEMLOCK must be set in a unit file such as
# /etc/systemd/system/elasticsearch.service.d/override.conf.
#MAX_LOCKED_MEMORY=unlimited

# Maximum number of VMA (Virtual Memory Areas) a process can own
# When using Systemd, this setting is ignored and the 'vm.max_map_count'
# property is set at boot time in /usr/lib/sysctl.d/elasticsearch.conf
#MAX_MAP_COUNT=262144

服务文件

# vim /usr/lib/systemd/system/elasticsearch.service
1
[Unit]
Description=Elasticsearch
Documentation=http://www.elastic.co
Wants=network-online.target
After=network-online.target

[Service]
RuntimeDirectory=elasticsearch
PrivateTmp=true
Environment=ES_HOME=/usr/local/elasticsearch
Environment=ES_PATH_CONF=/usr/local/elasticsearch/config
Environment=PID_DIR=/usr/local/elasticsearch/run
EnvironmentFile=-/etc/sysconfig/elasticsearch

WorkingDirectory=/usr/local/elasticsearch

User=elk
Group=elk

ExecStart=/usr/local/elasticsearch/bin/elasticsearch -p ${PID_DIR}/elasticsearch.pid --quiet

# StandardOutput is configured to redirect to journalctl since
# some error messages may be logged in standard output before
# elasticsearch logging system is initialized. Elasticsearch
# stores its logs in /var/log/elasticsearch and does not use
# journalctl by default. If you also want to enable journalctl
# logging, you can simply remove the "quiet" option from ExecStart.
StandardOutput=journal
StandardError=inherit

# Specifies the maximum file descriptor number that can be opened by this process
LimitNOFILE=65535

# Specifies the maximum number of processes
LimitNPROC=4096

# Specifies the maximum size of virtual memory
LimitAS=infinity

# Specifies the maximum file size
LimitFSIZE=infinity

# Disable timeout logic and wait until process is stopped
TimeoutStopSec=0

# SIGTERM signal is used to stop the Java process
KillSignal=SIGTERM

# Send the signal only to the JVM rather than its control group
KillMode=process

# Java process is never killed
SendSIGKILL=no

# When a JVM receives a SIGTERM signal it exits with code 143
SuccessExitStatus=143

[Install]
WantedBy=multi-user.target

# Built for packages-6.7.1 (packages)

管理服务:
# chmod +x /usr/lib/systemd/system/elasticsearch.service

# mkdir /usr/local/elasticsearch/run

# touch /usr/local/elasticsearch/run/elasticsearch.pid && chown -R elk:elk /usr/local/elasticsearch

# systemctl daemon-reload

# systemctl enable elasticsearch

# systemctl start elasticsearch                 #先kill之前的elasticsearch进程

# yum install -y bash-completion && source /etc/profile             #命令自动补全


########这玩意不太好用,我一般用
关闭 systemctl stop elasticsearch.service
启动 su - elk -c "/usr/local/elasticsearch/bin/elasticsearch -d"
出问题及时看日志
tail -f /usr/local/elasticsearch/logs/elk.log
Kibana
安装kibana:
# wget https://software-hc.oss-cn-beijing.aliyuncs.com/kibana-6.7.2-linux-x86_64.tar.gz
# tar zxf kibana-6.7.2-linux-x86_64.tar.gz && mv kibana-6.7.2-linux-x86_64 /usr/local/kibana
修改配置
# vim /usr/local/kibana/config/kibana.yml

server.port: 5601               #监听端口
server.host: "0.0.0.0"              #监听IP
elasticsearch.hosts: ["http://192.168.0.128:9200","http://192.168.0.129:9200","http://192.168.0.130:9200"]               #集群es地址
logging.dest: /usr/local/kibana/logs/kibana.log                 #日志路径
kibana.index: ".kibana"                 #默认索引

# mkdir /usr/local/kibana/logs && touch /usr/local/kibana/logs/kibana.log
启动kibana:
# /usr/local/kibana/bin/kibana &
配置成kibana服务:
# vim /etc/default/kibana
user="elk"
group="elk"
chroot="/"
chdir="/"
nice=""


# If this is set to 1, then when `stop` is called, if the process has
# not exited within a reasonable time, SIGKILL will be sent next.
# The default behavior is to simply log a message "program stop failed; still running"
KILL_ON_STOP_TIMEOUT=0

# vim /etc/systemd/system/kibana.service
[Unit]
Description=Kibana
StartLimitIntervalSec=30
StartLimitBurst=3

[Service]
Type=simple
User=elk
Group=elk
# Load env vars from /etc/default/ and /etc/sysconfig/ if they exist.
# Prefixing the path with '-' makes it try to load, but if the file doesn't
# exist, it continues onward.
EnvironmentFile=-/etc/default/kibana
EnvironmentFile=-/etc/sysconfig/kibana
ExecStart=/usr/local/kibana/bin/kibana "-c /usr/local/kibana/config/kibana.yml"
Restart=always
WorkingDirectory=/

[Install]
WantedBy=multi-user.target
管理服务:
# chown -R elk:elk /usr/local/kibana

# systemctl daemon-reload

# systemctl enable kibana

# systemctl start kibana                #先kill之前的kibana进程
kibana汉化:
# wget https://software-hc.oss-cn-beijing.aliyuncs.com/Kibana_Hanization.tar.gz
# tar zxvf Kibana_Hanization.tar.gz

# cp -r Kibana_Hanization-master/translations/ /usr/local/kibana/src/legacy/core_plugins/kibana/

# vim /usr/local/kibana/config/kibana.yml            #更改配置

i18n.locale: "zh-CN"

# systemctl restart kibana
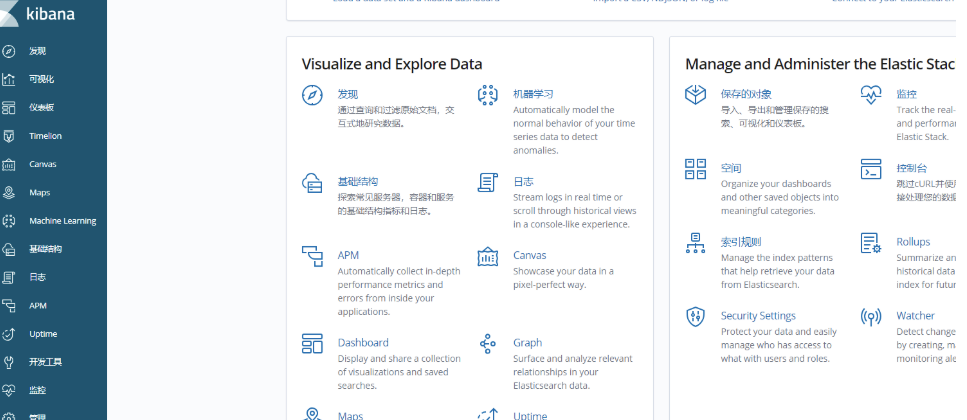
访问网页192.168.0.128:5601,可以看到汉化之后的kibana页面
logstash
安装logstash: 192.168.0.129
# wget https://software-hc.oss-cn-beijing.aliyuncs.com/logstash-6.7.0.zip
# unzip logstash-6.7.0.zip && mv logstash-6.7.0/ /usr/local/logstash
# mkdir /usr/local/logstash/conf.d     ### 创建收集日志子文件目录
修改配置:
# vim /usr/local/logstash/config/logstash.yml

http.host: "192.168.0.129"
http.port: 9600
以收集nginx 访问日志为例:
# yum install -y nginx

# vim /etc/nginx/nginx.conf

    log_format main2 '$http_host $remote_addr - $remote_user [$time_local] "$request" '
                      '$status $body_bytes_sent "$http_referer" '
                      '"$http_user_agent" "$upstream_addr" $request_time';

# vim /etc/nginx/conf.d/elk.conf

server {
      listen 80;
      server_name 192.168.0.129;

      location / {
          proxy_pass      http://192.168.0.128:5601;    #代理128的kibana
          proxy_set_header Host   $host;
          proxy_set_header X-Real-IP      $remote_addr;
          proxy_set_header X-Forwarded-For $proxy_add_x_forwarded_for;
      }

      access_log  /var/log/nginx/elk_access.log main2;  ###调用主配置文件http标签下的main2日志定义名字
}
配置logstash收集nginx日志配置文件:
# vim /usr/local/logstash/conf.d/nginx_access.conf

input {          ###收集日志
  file {
    path => "/var/log/nginx/elk_access.log"                 #设置为nginx访问日志的路径
    start_position => "beginning"
    type => "nginx"
  }
}
filter {        ####格式化日志
    grok {
        match => { "message" => "%{IPORHOST:http_host} %{IPORHOST:clientip} - %{USERNAME:remote_user} [%{HTTPDATE:timestamp}] "(?:%{WORD:http_verb} %{NOTSPACE:http_request}(?: HTTP/%{NUMBER:http_version})?|%{DATA:raw_http_request})" %{NUMBER:response} (?:%{NUMBER:bytes_read}|-) %{QS:referrer} %{QS:agent} %{QS:xforwardedfor} %{NUMBER:request_time:float}"}
    }
    geoip {
        source => "clientip"
    }
}
output {                    ###传到es主机展示
    stdout { codec => rubydebug }
    elasticsearch {
        hosts => ["192.168.0.129:9200"]                #也可以为集群内其它机器es的地址
        index => "nginx-test-%{+YYYY.MM.dd}"
  }
}
启动logstash:
# systemctl start nginx

# nohup /usr/local/logstash/bin/logstash --path.settings /usr/local/logstash/ -f /usr/local/logstash/conf.d/nginx_access.conf &    ###这里是指定了配置文件
查看elasticsearch-head页面

到kibana页面创建索引,查看访问日志

配置logstash服务:
服务配置文件
# vim /etc/default/logstash

LS_HOME="/usr/local/logstash"
LS_SETTINGS_DIR="/usr/local/logstash"
LS_PIDFILE="/usr/local/logstash/run/logstash.pid"
LS_USER="elk"
LS_GROUP="elk"
LS_GC_LOG_FILE="/usr/local/logstash/logs/gc.log"
LS_OPEN_FILES="16384"
LS_NICE="19"
SERVICE_NAME="logstash"
SERVICE_DESCRIPTION="logstash"
服务文件
# vim /etc/systemd/system/logstash.service

[Unit]
Description=logstash

[Service]
Type=simple
User=elk
Group=elk
# Load env vars from /etc/default/ and /etc/sysconfig/ if they exist.
# Prefixing the path with '-' makes it try to load, but if the file doesn't
# exist, it continues onward.
EnvironmentFile=-/etc/default/logstash
EnvironmentFile=-/etc/sysconfig/logstash
ExecStart=/usr/local/logstash/bin/logstash "--path.settings" "/usr/local/logstash/config" "--path.config" "/usr/local/logstash/conf.d"
Restart=always
WorkingDirectory=/
Nice=19
LimitNOFILE=16384

[Install]
WantedBy=multi-user.target
管理服务
# mkdir /usr/local/logstash/run && touch /usr/local/logstash/run/logstash.pid

# touch /usr/local/logstash/logs/gc.log && chown -R elk:elk /usr/local/logstash

# systemctl daemon-reload

# systemctl enable logstash

# systemctl start logstash                  #先kill之前的logstash进程
ps 服务管理不太好用,还没测试出好用的我常用’
关闭  systemctl stop logstash.service
启动  nohup /usr/local/logstash/bin/logstash --path.settings /usr/local/logstash/ -f /usr/local/logstash/conf.d/nginx_access.conf &
filebeat 192.168.30.130
安装filebeat:
# wget https://software-hc.oss-cn-beijing.aliyuncs.com/filebeat-6.7.1-linux-x86_64.tar.gz
# tar zxf filebeat-6.7.1-linux-x86_64.tar.gz && mv filebeat-6.7.1-linux-x86_64 /usr/local/filebeat
修改配置:
# vim /usr/local/filebeat/filebeat.yml

- type: log
#  enabled: false
  paths:
    - /var/log/messages                 #以系统日志为例

output.elasticsearch:
  hosts: ["192.168.0.130:9200"]
启动filebeat:
# nohup /usr/local/filebeat/filebeat -c /usr/local/filebeat/filebeat.yml &
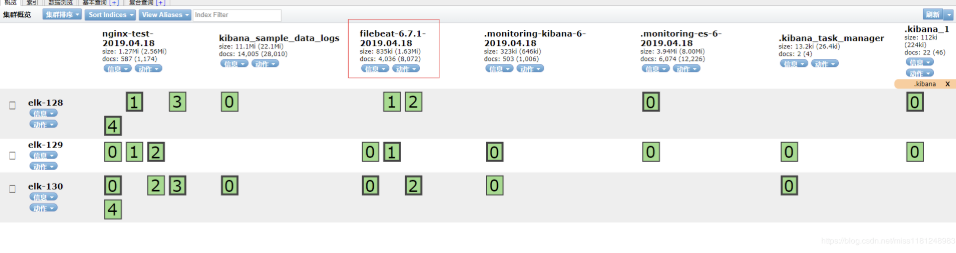
# curl '192.168.0.130:9200/_cat/indices?v'
health status index uuid pri rep docs.count docs.deleted store.size pri.store.size
green open .kibana_1 e3tbCkGlQJyl6HsGRYDhOQ 1 1 22 1 223.6kb 111.6kb
green open nginx-test-2019.04.18 GXOnWVKNTpq43Hk2KZ8ATQ 5 1 569 0 2.6mb 1.3mb
green open filebeat-6.7.1-2019.04.18 UR05k-apTOuFs_0-jZKeyQ 3 1 388 0 55.8kb 55.1kb
green open .monitoring-es-6-2019.04.18 MmYWIrrhTeiQqz9muZV4Ww 1 1 5879 20 7.8mb 3.9mb
green open kibana_sample_data_logs h9wLl6EORv-ptFDgFv-zrg 1 1 14005 0 22.1mb 11mb
green open .kibana_task_manager 5uM_sV5YQpGL6ZgNNxWqlw 1 1 2 0 26.4kb 13.2kb
green open .monitoring-kibana-6-2019.04.18 V_WQQSgpTOu6BK7cQTfOQg 1 1 489 0 518.6kb 259.3kb
多出来以filebeat开头的索引。
查看elasticsearch-head页面
配置filebeat服务:
服务文件:
# vim /usr/lib/systemd/system/filebeat.service

[Unit]
Description=Filebeat sends log files to Logstash or directly to Elasticsearch.
Documentation=https://www.elastic.co/products/beats/filebeat
Wants=network-online.target
After=network-online.target

[Service]
ExecStart=/usr/local/filebeat/filebeat -c /usr/local/filebeat/filebeat.yml -path.home /usr/local/filebeat -path.config /usr/local/filebeat -path.data /usr/local/filebeat/data -path.logs /usr/local/filebeat/logs
Restart=always

[Install]
WantedBy=multi-user.target
管理服务:
# systemctl daemon-reload

# systemctl enable filebeat

# systemctl start filebeat                  #先kill之前的filebeat进程