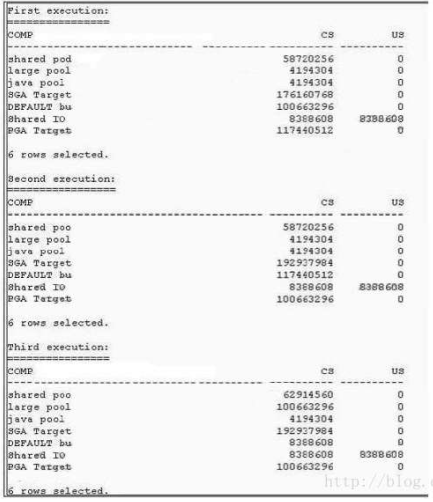
View the Exhibit to examine the output produced by the following query at three different times since the database instance started and has experienced workloads of different capacities:
SQL> SELECT substr(component, 0, 10) COMP, current_size CS, user_specified_size US FROM
v$memory_dynamic_components WHERE current_size!=0;
What do you infer from this?
A. The database instance is running with manual PGA management.
B. The database instance is running with manual shared memory management.
C. The database instance has the MEMORY_TARGET value set to a nonzero value.
D. All sessions are connected to the database instance in dedicated mode, and no RMAN or parallel query operations have been performed.
动态性能视图 V$MEMORY_DYNAMIC_COMPONENTS 显示所有动态优化的内存组件的当前大小,其中包括 SGA 和实例 PGA 的总大小。三次启动的 SGA 的各个组件大小都一样,是动态变化的,PGA 也是动态变化的,所以此数据库是处于自动内存管理即 AMM,也即是说 MEMORY_TARGET 设定为非零值