近日搭建一套基于ELK&Grafana的监控告警平台,目的是将生产端某性能日志导入ES中,通过Grafana进行可视化监测,同时设置告警。
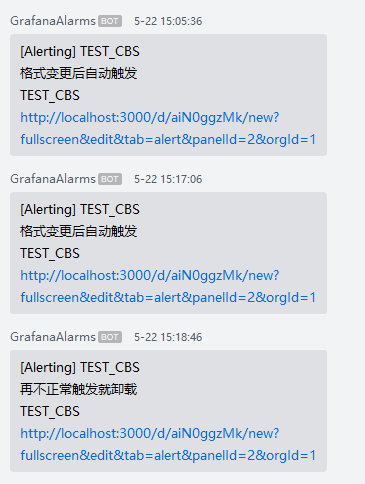
告警内容推送到自建的webhook服务后,转发到指定的企业微信机器人,这样可以在企业微信群中看到对应告警内容。
整体架构如下图:
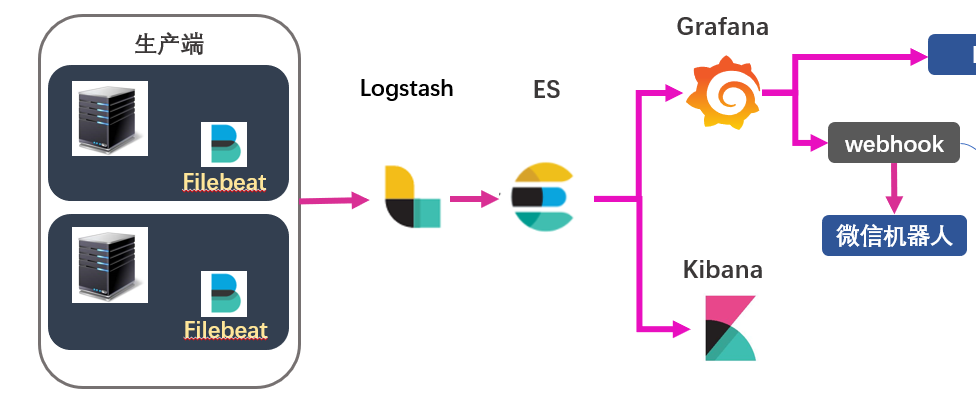
ELK部分略去不表。重点在于,自行编写webhook,解析告警内容并推送到企业微信机器人。
通过查看Grafana官网文档: https://grafana.com/docs/grafana/latest/alerting/notifications/#webhook 了解到,推送的告警内容为json,格式如下:
{
  "dashboardId":1,
  "evalMatches":[
    {
      "value":1,
      "metric":"Count",
      "tags":{}
    }
  ],
  "imageUrl":"https://grafana.com/static/assets/img/blog/mixed_styles.png",
  "message":"Notification Message",
  "orgId":1,
  "panelId":2,
  "ruleId":1,
  "ruleName":"Panel Title alert",
  "ruleUrl":"http://localhost:3000/d/hZ7BuVbWz/test-dashboard?fullscreenu0026editu0026tab=alertu0026panelId=2u0026orgId=1",
  "state":"alerting",
  "tags":{
    "tag name":"tag value"
  },
  "title":"[Alerting] Panel Title alert"
}
于是,webhook以此为标准进行数据解析。
一番操作后发现,企业微信机器人并未推送任何告警。
检查了告警推送条件,并尝试了邮件告警,都正常。
回过头来,单独check了Grafana推送的告警json,发现,巨坑。
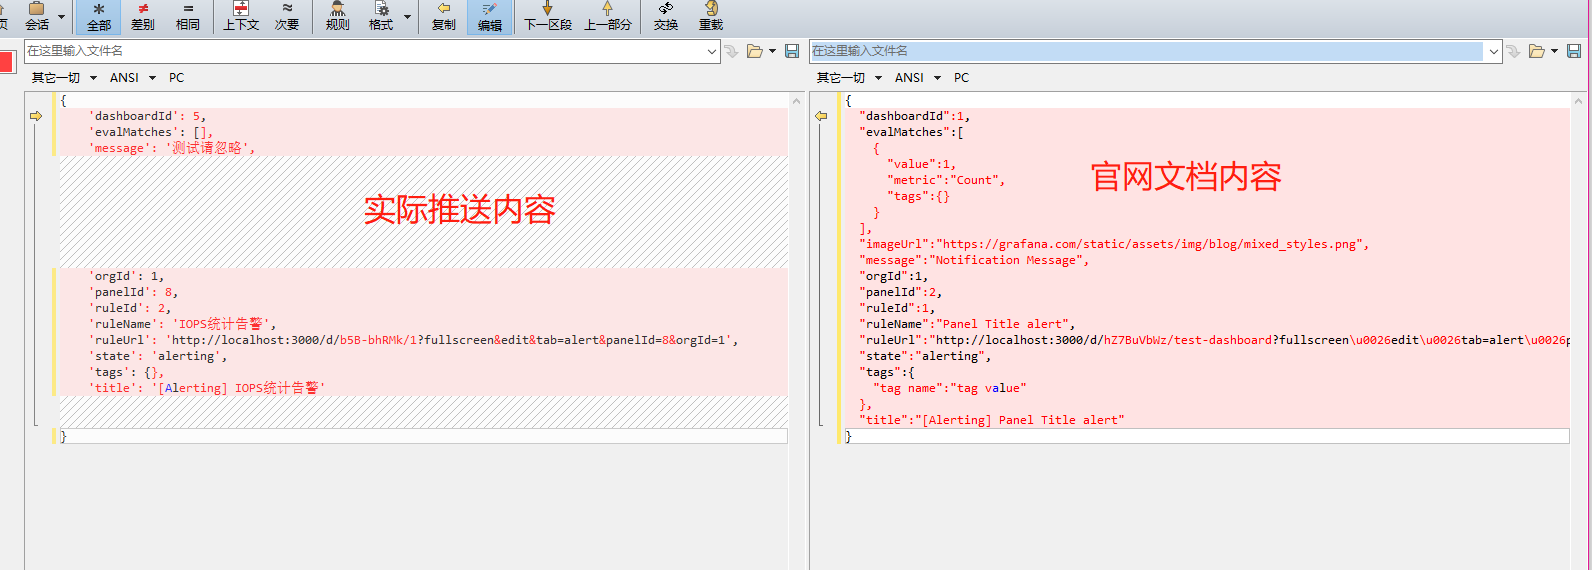
实际推送内容和官网文档中提供的字段不一致。
自此,修改代码,问题解决,告警效果如下。