
#!/usr/bin/python

import random
import numpy
import matplotlib.pyplot as plt
import pickle

from outlier_cleaner import outlierCleaner
from sklearn.linear_model import LinearRegression

### load up some practice data with outliers in it
ages = pickle.load( open("practice_outliers_ages.pkl", "r") )
net_worths = pickle.load( open("practice_outliers_net_worths.pkl", "r") )


### ages and net_worths need to be reshaped into 2D numpy arrays
### second argument of reshape command is a tuple of integers: (n_rows, n_columns)
### by convention, n_rows is the number of data points
### and n_columns is the number of features
ages       = numpy.reshape( numpy.array(ages), (len(ages), 1))
net_worths = numpy.reshape( numpy.array(net_worths), (len(net_worths), 1))
from sklearn.model_selection import train_test_split
ages_train, ages_test, net_worths_train, net_worths_test = train_test_split(ages, net_worths, test_size=0.1, random_state=42)

### fill in a regression here!  Name the regression object reg so that
### the plotting code below works, and you can see what your regression looks like

reg = LinearRegression().fit(ages_train, net_worths_train)
print('score', reg.score(ages_test, net_worths_test))
print('slope', reg.coef_)


try:
    plt.plot(ages, reg.predict(ages), color="blue")
except NameError:
    pass
plt.scatter(ages, net_worths)
plt.show()


### identify and remove the most outlier-y points
cleaned_data = []
try:
    predictions = reg.predict(ages_train)
    cleaned_data = outlierCleaner( predictions, ages_train, net_worths_train )
except NameError:
    print "your regression object doesn't exist, or isn't name reg"
    print "can't make predictions to use in identifying outliers"


### only run this code if cleaned_data is returning data
if len(cleaned_data) > 0:
    ages, net_worths, errors = zip(*cleaned_data)
    ages       = numpy.reshape( numpy.array(ages), (len(ages), 1))
    net_worths = numpy.reshape( numpy.array(net_worths), (len(net_worths), 1))

    ### refit your cleaned data!
    try:
        reg.fit(ages, net_worths)
        print('new slope', reg.coef_)
        print('new score', reg.score(ages_test, net_worths_test))
        plt.plot(ages, reg.predict(ages), color="red")
    except NameError:
        print "you don't seem to have regression imported/created,"
        print "   or else your regression object isn't named reg"
        print "   either way, only draw the scatter plot of the cleaned data"
    plt.scatter(ages, net_worths)
    plt.xlabel("ages")
    plt.ylabel("net worths")
    plt.show()

else:
    print "outlierCleaner() is returning an empty list, no refitting to be done"
#!/usr/bin/python
import math

def outlierCleaner(predictions, ages, net_worths):
    """
        Clean away the 10% of points that have the largest
        residual errors (difference between the prediction
        and the actual net worth).

        Return a list of tuples named cleaned_data where
        each tuple is of the form (age, net_worth, error).
    """

    cleaned_data = []
    total = int(len(predictions)*0.9)

    ### your code goes here
    for i in range(len(predictions)):
        tuple = (ages[i][0], net_worths[i][0], math.fabs(predictions[i][0] - net_worths[i][0]))
        cleaned_data.append(tuple)

    cleaned_data.sort(key=error_aesc_sort)

    return cleaned_data[:total]

def error_aesc_sort(e):
    return e[2]
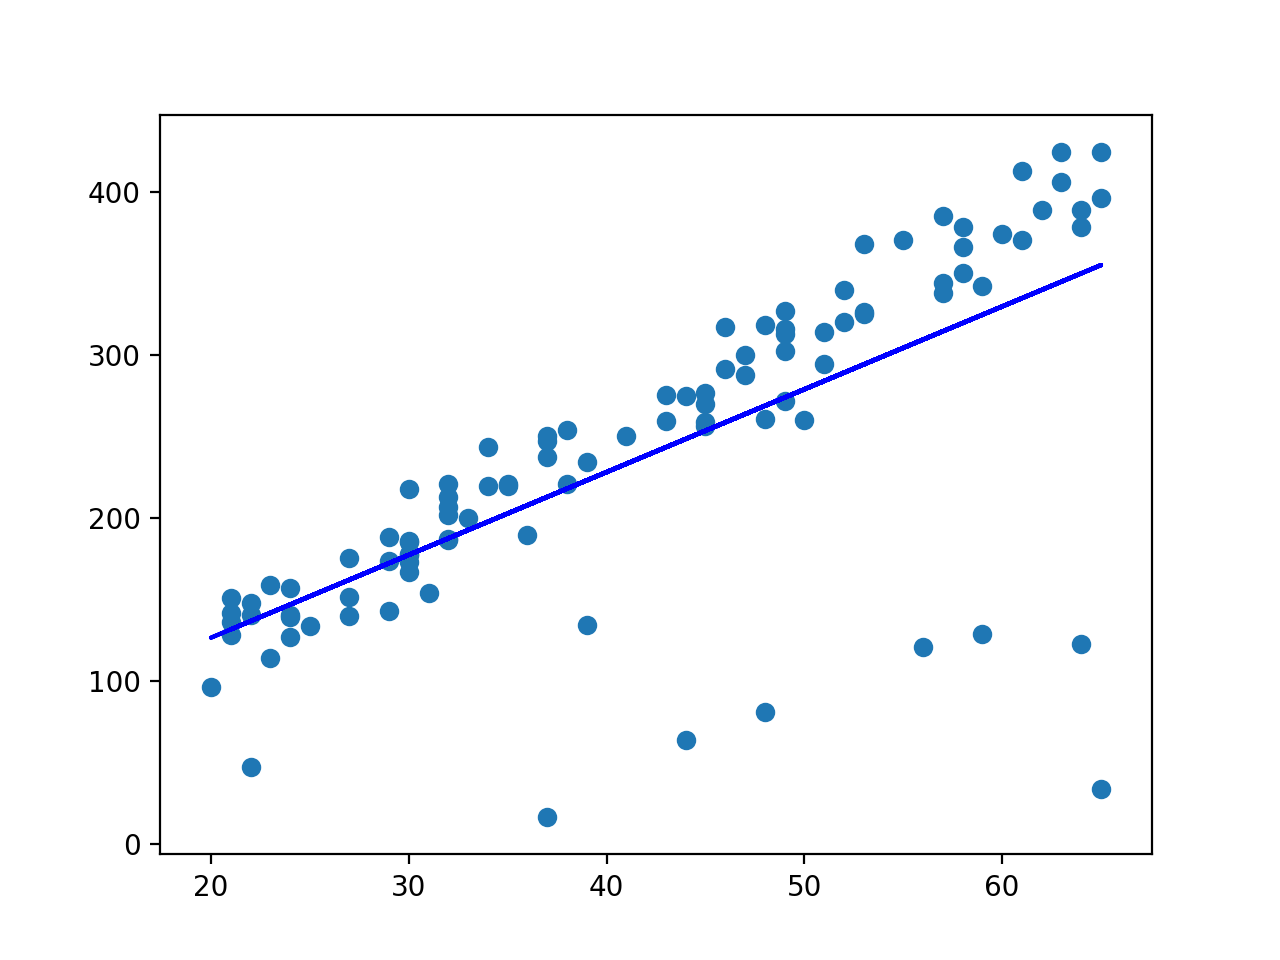
('score', 0.8782624703664675)
('slope', array([[5.07793064]]))
('new slope', array([[6.36859481]]))
('new score', 0.983189455395532)