同matlab一样,matplot也可画散列图scatter。


 1 import numpy as np
 2 import matplotlib.pyplot as plt
 3 #fig = plt.figure()
 4 #ax = fig.add_subplot(111)
 5 a1 = np.array([1, 2, 3, 4])
 6 a2 = np.array([1, 2, 3, 4])
 7 #ax.scatter(np.random.rand(5), np.random.rand(5))
 8 #mark = ['s','o','^','v','>','<','d','p','h','8','+','*']
 9 #ax.scatter(a1, a2, marker='s', color='blue')
10 plt.scatter(a1, a2, marker='s', color='blue', label="TT")
11 #fig.show()
12 plt.legend()
13 plt.show()
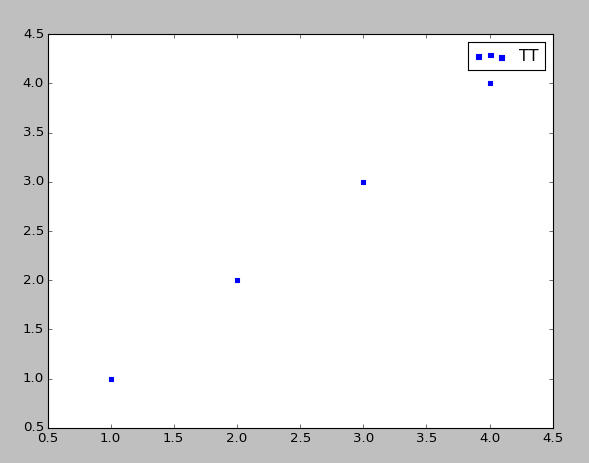
显示结果: