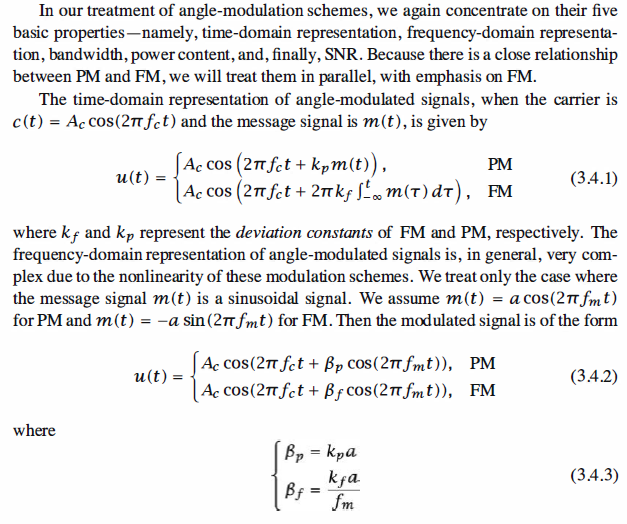
Angle Modulation
Angle-modulation schemes, which include frequency modulation (FM) and phase modulation
(PM), belong to the class of nonlinear modulation schemes. This family of
modulation schemes is characterized by high-bandwidth requirements and good performance
in the presence of noise. These schemes can be visualized as modulation
techniques that tradeoff bandwidth for power and, therefore, are used in situations
where bandwidth is not the major concern and a high SNR is required. Frequency
modulation is widely used in high-fidelity FM broadcasting, TV audio broadcasting,
microwave carrier modulation, and point-to-point communication systems.
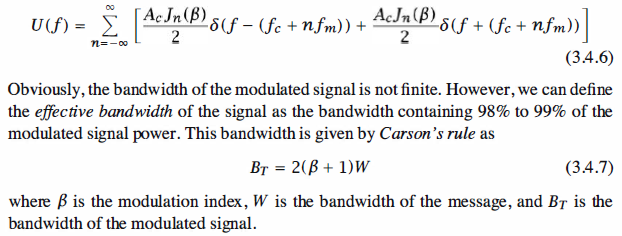
In the frequency domain we have,
Matlab Coding
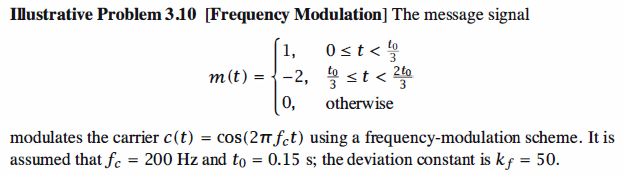

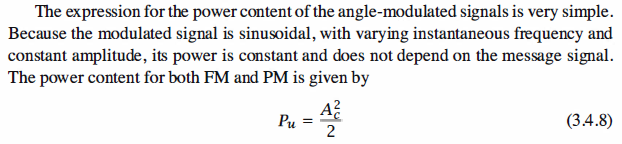
1 % MATLAB script for Illustrative Problem 3.10. 2 % Demonstration script for frequency modulation. The message signal 3 % is +1 for 0 < t < t0/3, -2 for t0/3 < t < 2t0/3, and zero otherwise. 4 echo on 5 t0=.15; % signal duration 6 ts=0.0005; % sampling interval 7 fc=200; % carrier frequency 8 kf=50; % modulation index 9 fs=1/ts; % sampling frequency 10 t=[0:ts:t0]; % time vector 11 df=0.25; % required frequency resolution 12 % message signal 13 m=[ones(1,t0/(3*ts)),-2*ones(1,t0/(3*ts)),zeros(1,t0/(3*ts)+1)]; 14 int_m(1)=0; 15 for i=1:length(t)-1 % integral of m 16 int_m(i+1)=int_m(i)+m(i)*ts; 17 echo off ; 18 end 19 echo on ; 20 [M,m,df1]=fftseq(m,ts,df); % Fourier transform 21 M=M/fs; % scaling 22 f=[0:df1:df1*(length(m)-1)]-fs/2; % frequency vector 23 u=cos(2*pi*fc*t+2*pi*kf*int_m); % modulated signal 24 [U,u,df1]=fftseq(u,ts,df); % Fourier transform 25 U=U/fs; % scaling
26 pause % Press any key to see a plot of the message and the modulated signal. 27 subplot(2,1,1) 28 plot(t,m(1:length(t))) 29 axis([0 0.15 -2.1 2.1]) 30 xlabel('Time') 31 title('The message signal') 32 subplot(2,1,2) 33 plot(t,u(1:length(t))) 34 axis([0 0.15 -2.1 2.1]) 35 xlabel('Time') 36 title('The modulated signal')
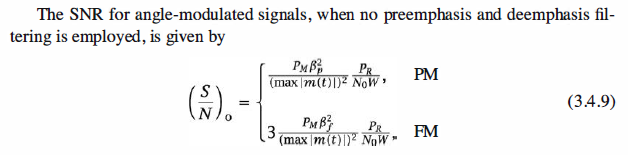
37 pause % Press any key to see plots of the magnitude of the message and the 38 % modulated signal in the frequency domain. 39 subplot(2,1,1) 40 plot(f,abs(fftshift(M))) 41 xlabel('Frequency') 42 title('Magnitude spectrum of the message signal') 43 subplot(2,1,2) 44 plot(f,abs(fftshift(U))) 45 title('Magnitude spectrum of the modulated signal') 46 xlabel('Frequency')
The message and the modulated signal
The message and the modulated signal in the frequency domain

Reference,
1. <<Contemporary Communication System using MATLAB>> - John G. Proakis