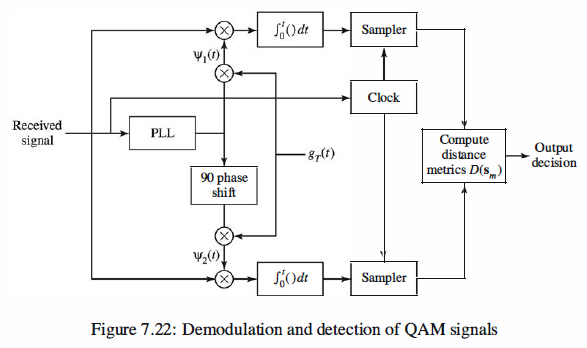
Demodulation and Detection of QAM (Quadrature Amplitude Modulation)
Matlab Coding
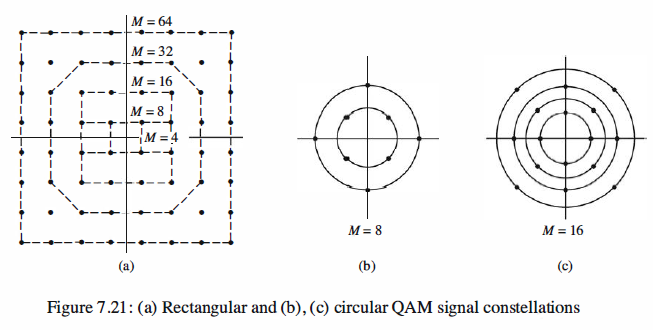
For the M = 8 QAM signal constellation shown in Figure 7.21(b) that

1 % MATLAB script 2 3 M = 8; 4 Es = 1; % Energy oer symbol 5 T = 1; 6 Ts = 100/T; 7 fc = 30/T; 8 t = 0:T/100:T; 9 l_t = length(t); 10 A_mc = 1/sqrt(Es); % Signal Amplitude 11 A_ms = -1/sqrt(Es); % Signal Amplitude 12 g_T = sqrt(2/T)*ones(1,l_t); 13 phi = 2*pi*rand; 14 si_1 = g_T.*cos(2*pi*fc*t + phi); 15 si_2 = g_T.*sin(2*pi*fc*t + phi);
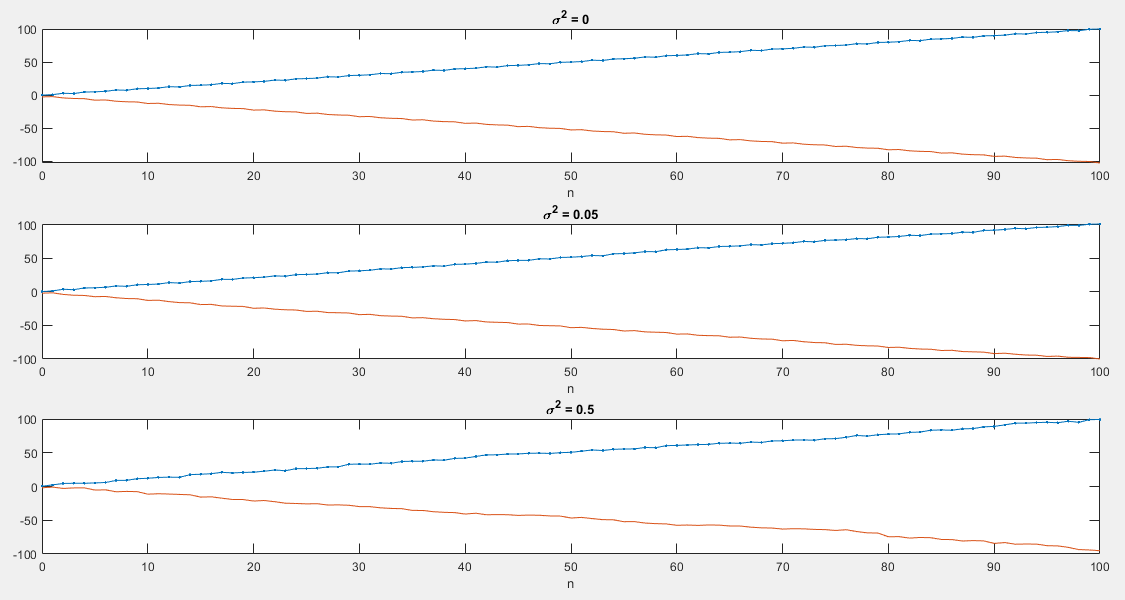
16 var = [ 0 0.05 0.5]; % Noise variance vector 17 for k = 1 : length(var) 18 % Generation of the noise components: 19 n_c = sqrt(var(k))*randn(1,l_t); 20 n_s = sqrt(var(k))*randn(1,l_t); 21 noise = n_c.*cos(2*pi*fc+t) - n_s.*sin(2*pi*fc+t); 22 % The received signal 23 r = A_mc*g_T.*cos(2*pi*fc*t+phi) + A_ms*g_T.*sin(2*pi*fc*t+phi) + noise; 24 % The correlator outputs: 25 y_c = zeros(1,l_t); 26 y_s = zeros(1,l_t); 27 for i = 1:l_t 28 y_c(i) = sum(r(1:i).*si_1(1:i)); 29 y_s(i) = sum(r(1:i).*si_2(1:i)); 30 end 31 % Plotting the results: 32 subplot(3,1,k) 33 plot([0 1:length(y_c)-1],y_c,'.-') 34 hold 35 plot([0 1:length(y_s)-1],y_s) 36 title(['sigma^2 = ',num2str(var(k))]) 37 xlabel('n') 38 axis auto 39 end
Simulation Result
Reference,
1. <<Contemporary Communication System using MATLAB>> - John G. Proakis