Demodulation of PAM Signals

Matlab Coding
1 % MATLAB script 2 echo on 3 T=1; 4 delta_T=T/200; % sampling interval 5 alpha=0.5; % rolloff factor 6 fc=40/T; % carrier frequency 7 A_m=1; % amplitude 8 t=-5*T+delta_T:delta_T:5*T; % time axis 9 N=length(t); 10 for i=1:N, 11 if (abs(t(i))~=T/(2*alpha)), 12 g_T(i) = sinc(t(i)/T)*(cos(pi*alpha*t(i)/T)/(1-4*alpha^2*t(i)^2/T^2)); 13 else 14 g_T(i) = 0; % The value of g_T is 0 at t=T/(2*alpha) and at t=-T/(2*alpha) 15 end;
16 echo off ; 17 end; 18 echo on;
19 G_T=abs(fft(g_T)); % spectrum of g_T 20 u_m=A_m*g_T.*cos(2*pi*fc*t); % the modulated signal 21 U_m=abs(fft(u_m)); % spectrum of the modulated signal
22 % actual frequency scale 23 f=-0.5/delta_T:1/(delta_T*(N-1)):0.5/delta_T;
24 % Plotting commands follow. 25 figure(1); 26 plot(f,fftshift(G_T)); 27 axis([-1/T 1/T 0 max(G_T)]); 28 figure(2); 29 plot(f,fftshift(U_m));
Simulaiton Result
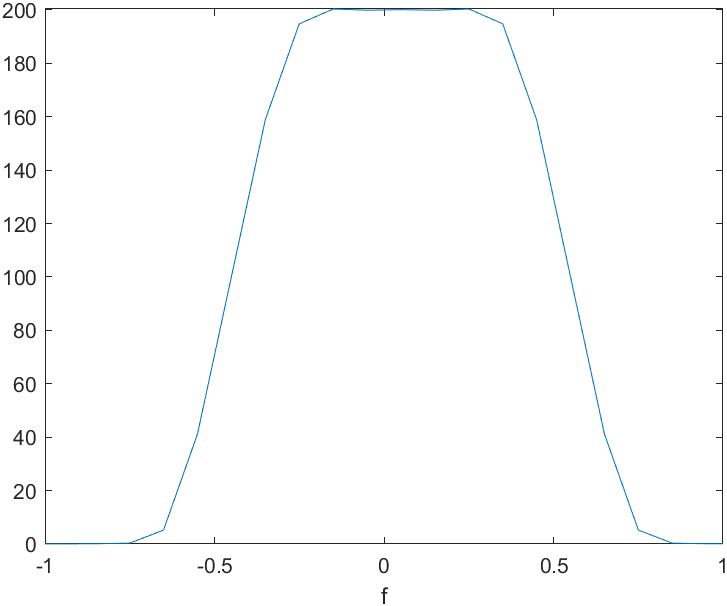
Spectra of baseband signal
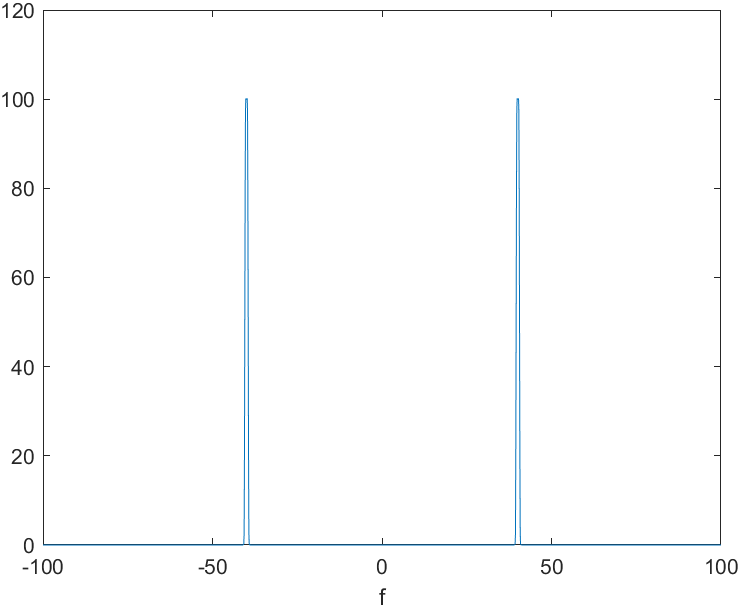
spectra of amplitude-modulated(bandpass) signal

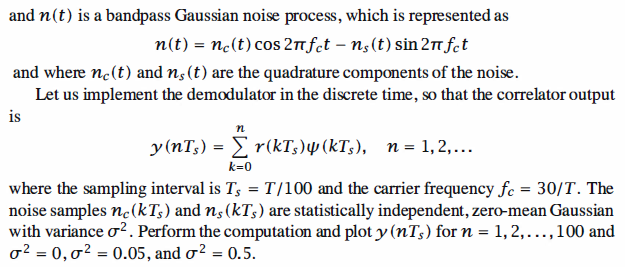
 1 % MATLAB script
 2
 3 Am = 1;                                 % Signal Amplitude
 4 T = 1;
 5 Ts = 100/T;
 6 fc = 30/T;
 7 t = 0:T/100:T;
 8 l_t = length(t);
 9 g_T = sqrt(2/T)*ones(1,l_t);
10 si = g_T .* cos(2*pi*fc*t);
11 var = [ 0 0.05 0.5];                    % Noise variance vector
12 for k = 1 : length(var)
13     % Generation of the noise components:
14     n_c = sqrt(var(k))*randn(1,l_t);
15     n_s = sqrt(var(k))*randn(1,l_t);
16     noise = n_c.*cos(2*pi*fc*t) - n_s.*sin(2*pi*fc*t);
17     r = Am*g_T.*cos(2*pi*fc*t)+noise;   % The received signal
18     y = zeros(1,l_t);
19     for i = 1:l_t
20         y(i) = sum(r(1:i).*si(1:i));    % The correlator output
21     end
22     % Plotting the results:
23     subplot(3,1,k)
24     plot([0 1:length(y)-1],y)
25     title(['sigma^2 = ',num2str(var(k))])
26     xlabel('n')
27     ylabel('y(nT_s)')
28 end

Simulation Result

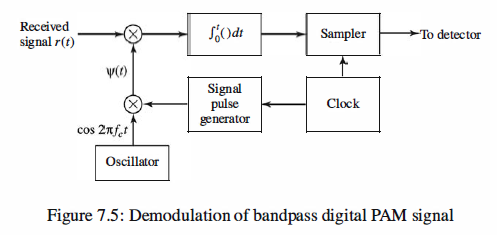
Reference,
1. <<Contemporary Communication System using MATLAB>> - John G. Proakis