Simulation of a Binary Communication System
Monte Carlo computer simulations are usually performed in practice to estimate the
probability of error of a digital communication system, especially in cases where the
analysis of the detector performance is difficult to perform. We demonstrate the method
for estimating the probability of error for the binary communication system described
previously.
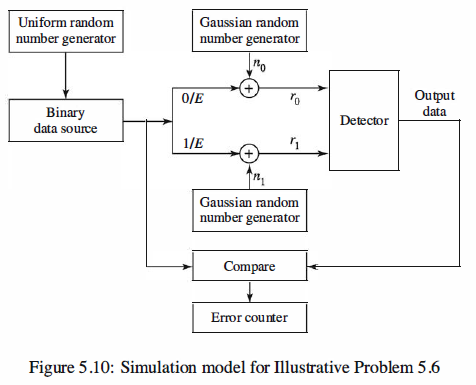
Use Monte Carlo simulation to estimate and plot Pe versus SNR for a binary communication system that employs
correlators or matched filters. The model of the system is illustrated in Figure 5.10.
Matlab Coding
 1 % MATLAB script for Simulation of a Binary Communication System 2 echo on
 3 SNRindB1=0:1:12;
 4 SNRindB2=0:0.1:12;
 5 for i=1:length(SNRindB1),
 6     % simulated error rate
 7     smld_err_prb(i)=smldPe54(SNRindB1(i));
 8     echo off ;
 9 end;
10 echo on ;

11 for i=1:length(SNRindB2),
12     SNR=exp(SNRindB2(i)*log(10)/10);
13     % theoretical error rate
14     theo_err_prb(i)=Qfunct(sqrt(SNR));
15     echo off ;
16 end;
17 echo on;

18 % Plotting commands follow.
19 semilogy(SNRindB1,smld_err_prb,'*');
20 hold
21 semilogy(SNRindB2,theo_err_prb);
22 legend('Simulation','Theoretical')
23 xlabel('SNR')
24 ylabel('Probability of error')
25

26 function [p]=smldPe54(snr_in_dB)
27 % [p]=smldPe54(snr_in_dB)
28 %        SMLDPE54  finds the probability of error for the given
29 %           snr_in_dB, signal-to-noise ratio in dB.

30 E=1;                                     % normalized
31 SNR=exp(snr_in_dB*log(10)/10);           % signal-to-noise ratio
32 sgma=E/sqrt(2*SNR);               % sigma, standard deviation of noise
33 N=10000;

34 % generation of the binary data source
35 for i=1:N,
36   temp=rand;                         % a uniform random variable over (0,1)
37   if (temp<0.5),
38     dsource(i)=0;                     % With probability 1/2, source output is 0.
39   else
40     dsource(i)=1;                  % With probability 1/2, source output is 1.
41   end
42 end;

43 % detection, and probability of error calculation
44 numoferr=0;

45 for i=1:N,
46   % matched filter outputs
47   if (dsource(i)==0),
48     r0=E+gngauss(sgma);
49     r1=gngauss(sgma);                  % if the source output is "0"
50   else
51     r0=gngauss(sgma);
52     r1=E+gngauss(sgma);                % if the source output is "1"
53   end;
54   % Detector follows.
55   if (r0>r1),
56     decis=0;                      % Decision is "0".
57   else
58     decis=1;                      % Decision is "1".
59   end;
60   if (decis~=dsource(i)),            % If it is an error, increase the error counter.
61     numoferr=numoferr+1;
62   end;
63 end;
64 p=numoferr/N;                        % probability of error estimate

Simulation Result
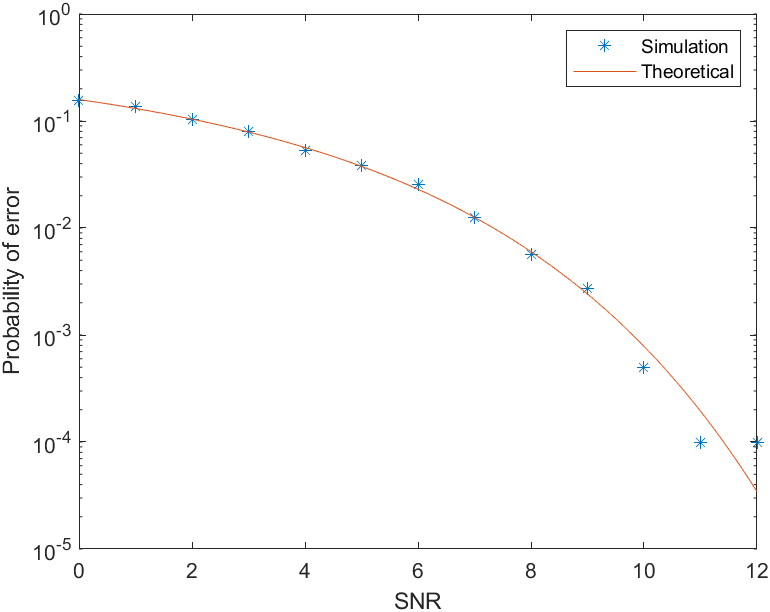
We should also note that a simulation of N = 10,000 data bits allows us to estimate the error probability
reliably down to about Pe = 10-4. In other words, with N = 10,000 data bits, we
should have at least one error for a reliable estimate of Pe.
In the gigure, simulation and theoretical results completely agree at low signal-tonoise
ratios, whereas at higher SNRs they agree less. Can you explain why? How
should we change the simulation process to result in better agreement at higher signalto-
noise ratios?
Reference,
1. <<Contemporary Communication System using MATLAB>> - John G. Proakis