一 Metricbeat 简介

1.1 系统级监控,更简洁将
Metricbeat 部署到您的所有 Linux、Windows 和 Mac 主机,并将它连接到 Elasticsearch 就大功告成了:您可以获取系统级的 CPU 使用率、内存、文件系统、磁盘 IO 和网络 IO 统计数据,还可针对系统上的每个进程获得与 top 命令类似的统计数据
1.2 单个二进制文件提供多种模块
Metricbeat 提供多种内部模块,这些模块可从多项服务(诸如 Apache、Jolokia、NGINX、MongoDB、MySQL、PostgreSQL、Prometheus 等等)中收集指标。安装简单,完全零依赖性。只需在配置文件中启用您所需的模块即可。
而且,如果要找的模块,还可以自己构建。以 Go 语言编写 Metricbeat 模块,过程十分简单。
1.3 容器就绪
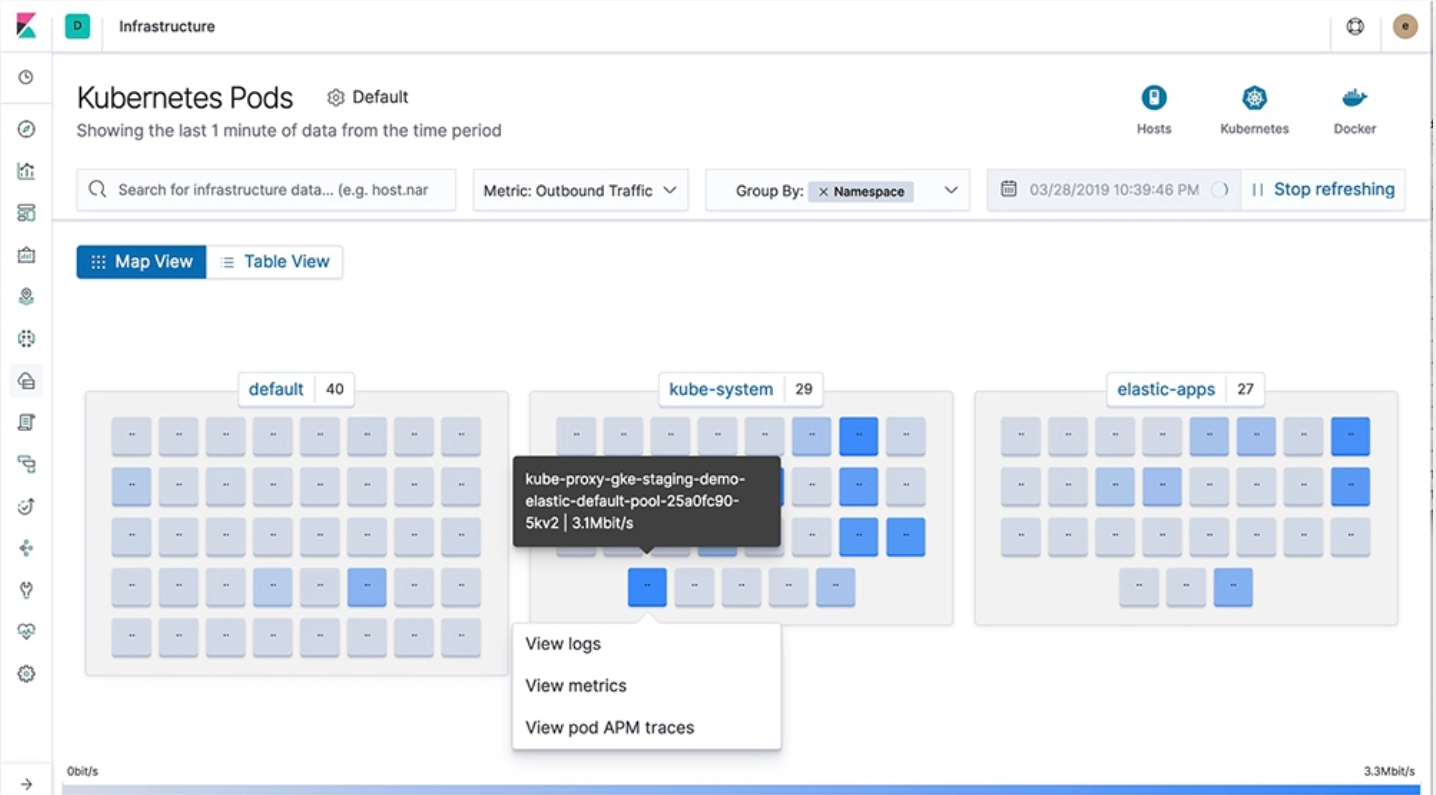
近来是不是所有工作都转移到了 Docker 中?通过 Elastic Stack,您能够轻松地监测容器。将 Metricbeat 部署到同一台主机上的一个单独容器后,它将收集与主机上运行的其他每一个容器相关的统计数据。在收集统计数据时,它直接从 proc 文件系统读取 cgroup 信息,这就意味着它无需特权即可访问 Docker API,并且同样适用于其他 Runtime。针对 Docker 的 Autodiscovery 让事情进一步简化,只需指定一个条件即可开启 Metricbeat 模块。
1.4 不错过任何检测信号
将指标通过假脱机传输方式输送至磁盘,这样您的数据管道再也不会错过任何一个数据点,即使发生中断(例如网络问题),也勿需担心。Metricbeat 会保留传入的数据,并在重新上线后将这些指标输送至 Elasticsearch 或 Logstash。
1.5 输送至 Elasticsearch 或 Logstash。在 Kibana 中实现可视化
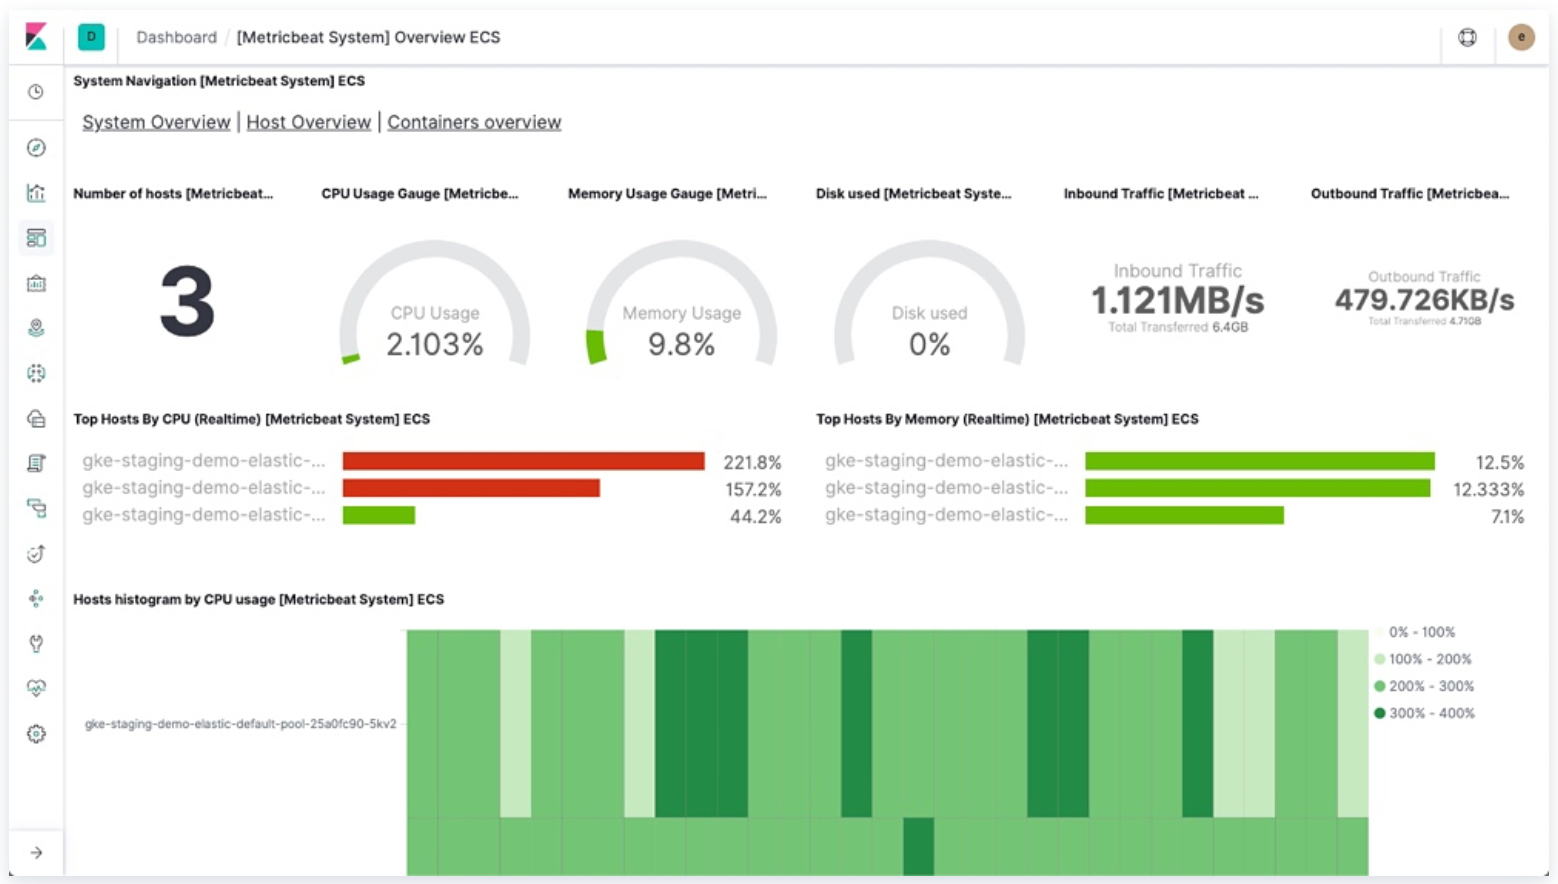
Metricbeat 是 Elastic Stack 的一部分,因此能够与 Logstash、Elasticsearch 和 Kibana 无缝协作。无论您要使用 Logstash 转换或充实指标,还是在 Elasticsearch 中随意处理一些数据分析,亦或在 Kibana 中构建和分享仪表板,Metricbeat 都能轻松地将您的数据发送至最关键的地方。
定期手机操作系统或应用服务器的指标数据
存储到elasticsearch中,进行实时分析
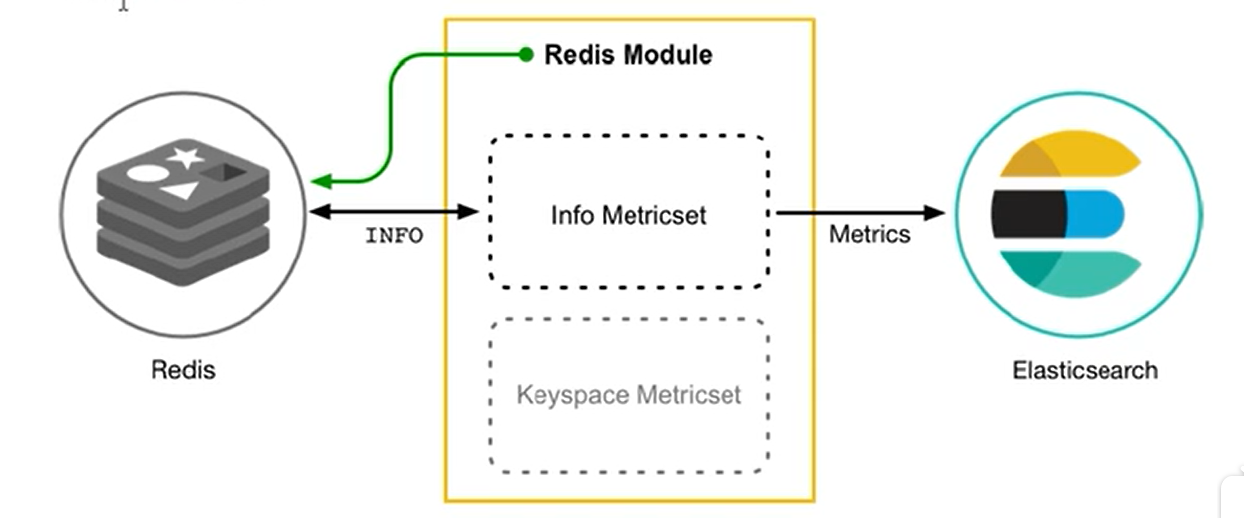
Metricbeat组成
由两部分组成,一部分是module,另一部分是Metricset
Module收集的对象,如mysql,redis,nginx操作系统等
metricset:收集指标的集合,如cpu,memeory,network等
以redis Module为例
二 安装部署metribeat
2.1 下载包
[root@node4 filebeat]# cd /usr/local/src/
[root@node4 src]# wget https://artifacts.elastic.co/downloads/beats/metricbeat/metricbeat-7.4.2-linux-x86_64.tar.gz
[root@node4 src]# tar -xf metricbeat-7.4.2-linux-x86_64.tar.gz
[root@node4 src]# mv metricbeat-7.4.2-linux-x86_64 /usr/local/metricbeat
[root@node4 src]# cd /usr/local/metricbeat
2.2 配置
[root@node4 metricbeat]# grep -Ev "^$|[#;]" metricbeat.yml
metricbeat.config.modules:
  path: ${path.config}/modules.d/*.yml
  reload.enabled: false
setup.template.settings:
  index.number_of_shards: 1
  index.codec: best_compression
setup.kibana:
output.elasticsearch:
  hosts: hosts: ["192.168.132.131:9200","192.168.132.132:9200","192.168.132.133:9200"]
processors:
  - add_host_metadata: ~
  - add_cloud_metadata: ~
[root@node4 metricbeat]# cd modules.d/
aerospike.yml.disabled    elasticsearch-xpack.yml.disabled  kvm.yml.disabled             prometheus.yml.disabled
apache.yml.disabled       elasticsearch.yml.disabled        logstash-xpack.yml.disabled  rabbitmq.yml.disabled
aws.yml.disabled          envoyproxy.yml.disabled           logstash.yml.disabled        redis.yml.disabled
beat-xpack.yml.disabled   etcd.yml.disabled                 memcached.yml.disabled       statsd.yml.disabled
beat.yml.disabled         golang.yml.disabled               mongodb.yml.disabled         system.yml
ceph.yml.disabled         graphite.yml.disabled             mssql.yml.disabled           traefik.yml.disabled
cockroachdb.yml.disabled  haproxy.yml.disabled              munin.yml.disabled           uwsgi.yml.disabled
consul.yml.disabled       http.yml.disabled                 mysql.yml.disabled           vsphere.yml.disabled
coredns.yml.disabled      jolokia.yml.disabled              nats.yml.disabled            windows.yml.disabled
couchbase.yml.disabled    kafka.yml.disabled                nginx.yml.disabled           zookeeper.yml.disabled
couchdb.yml.disabled      kibana-xpack.yml.disabled         oracle.yml.disabled
docker.yml.disabled       kibana.yml.disabled               php_fpm.yml.disabled
dropwizard.yml.disabled   kubernetes.yml.disabled           postgresql.yml.disabled
默认只读取system.yml的文件
启动
[root@node4 metricbeat]# ./metricbeat -e
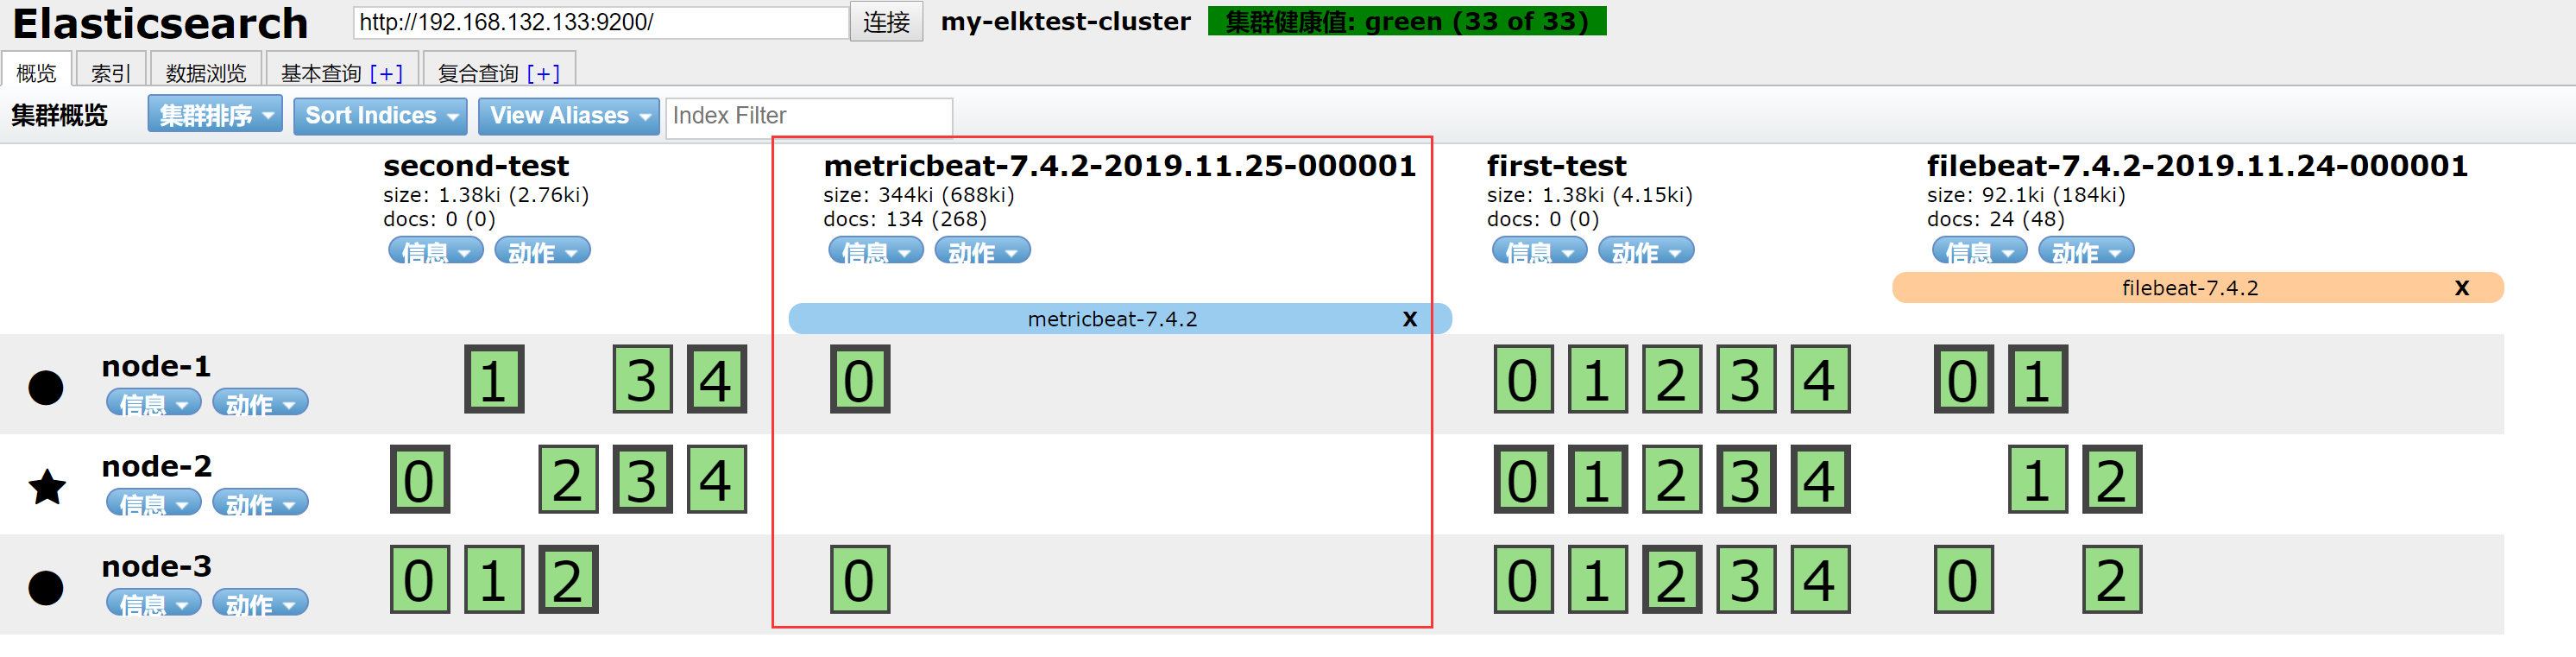
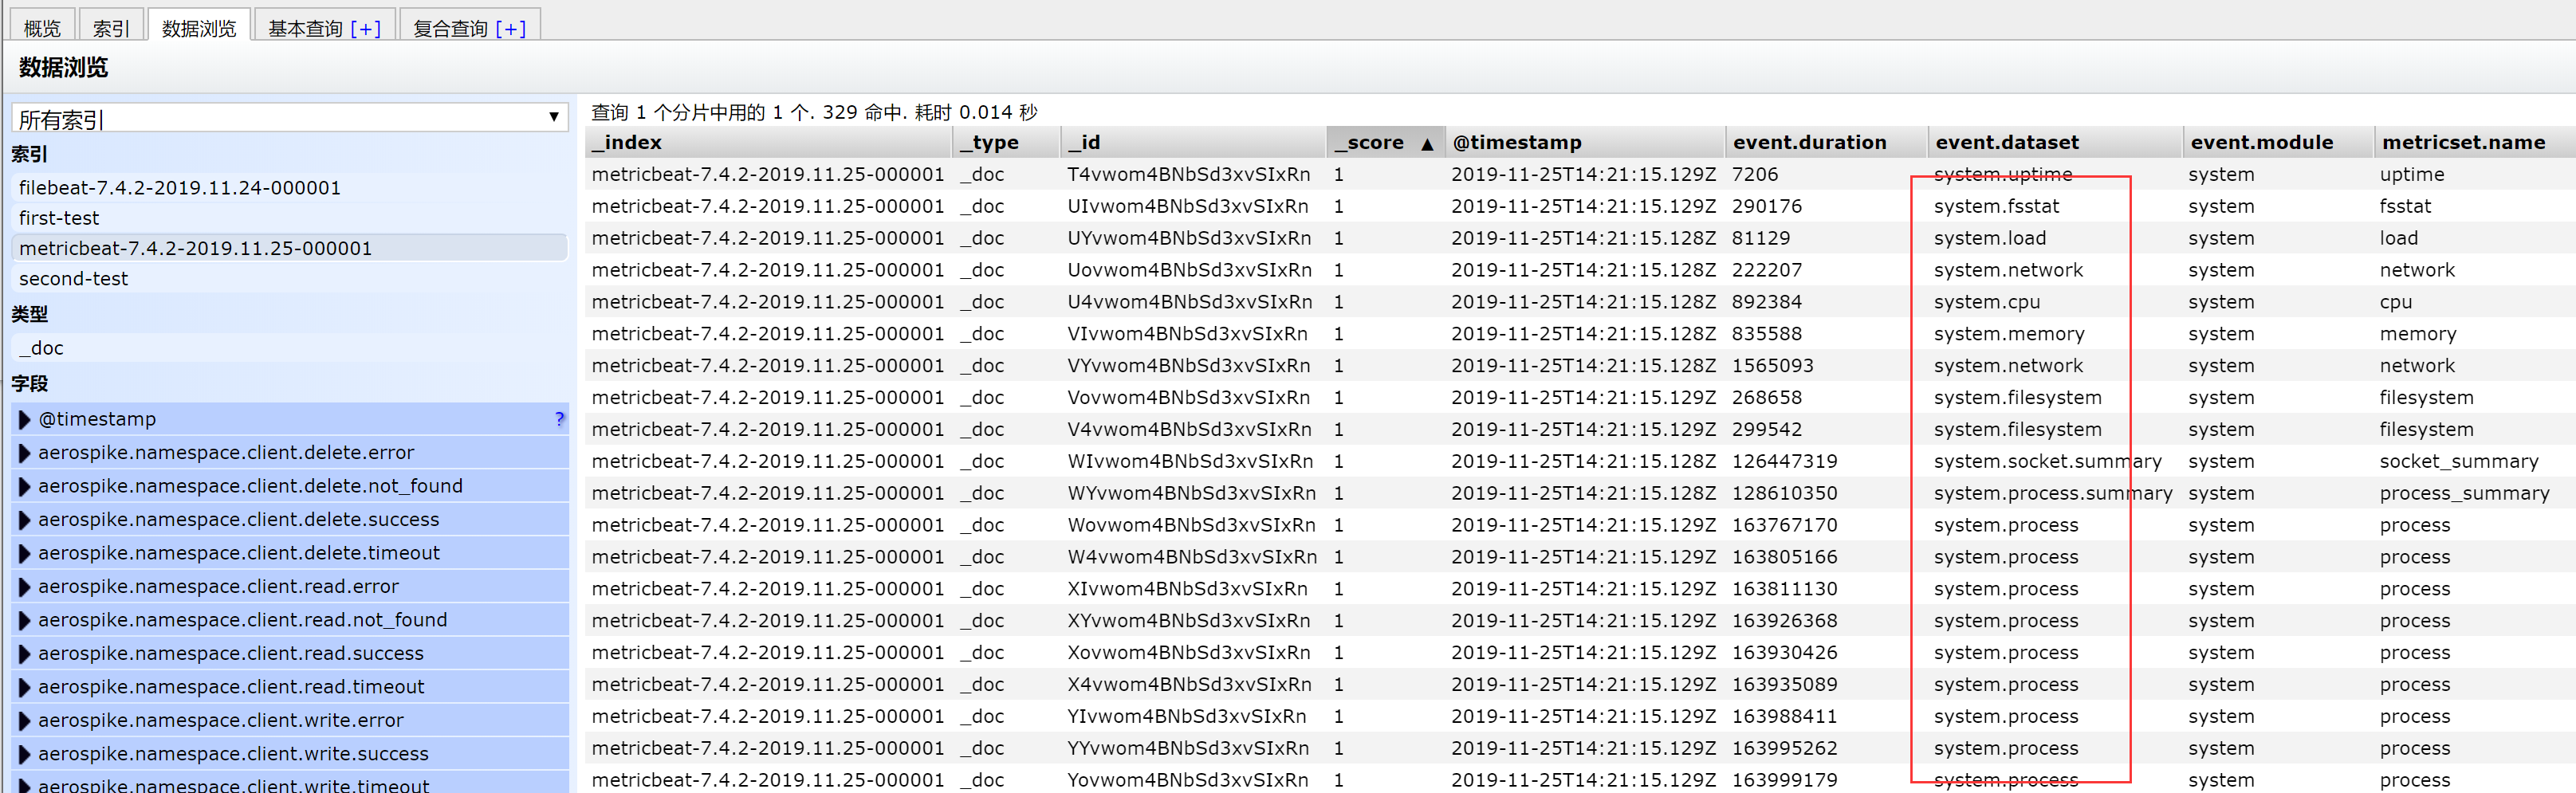
刷新elasticsearch,多了一个metricbeat的索引
看指标数据
看一下system.yml的一些配置
[root@node4 metricbeat]# grep -Ev "^$|[#;]" modules.d/system.yml
- module: system
  period: 10s
  metricsets:
    - cpu
    - load
    - memory
    - network
    - process
    - process_summary
    - socket_summary
  process.include_top_n:
- module: system
  period: 1m
  metricsets:
    - filesystem
    - fsstat
  processors:
  - drop_event.when.regexp:
      system.filesystem.mount_point: '^/(sys|cgroup|proc|dev|etc|host|lib)($|/)'
- module: system
  period: 15m
  metricsets:
    - uptime
三 metribeat的module配置
[root@node4 metricbeat]# ./metricbeat modules list
Enabled:
system

Disabled:
aerospike
apache
aws
beat
beat-xpack
ceph
cockroachdb
consul
coredns
couchbase
couchdb
docker
dropwizard
elasticsearch
elasticsearch-xpack
envoyproxy
etcd
golang
graphite
haproxy
http
jolokia
kafka
kibana
kibana-xpack
kubernetes
kvm
logstash
logstash-xpack
memcached
mongodb
mssql
munin
mysql
nats
nginx
oracle
php_fpm
postgresql
prometheus
rabbitmq
redis
statsd
traefik
uwsgi
vsphere
windows
zookeeper
3.1 配置nginx module的状态查询
在nginx中,只有开启状态查询,才能查询到指标数据
[root@node4 metricbeat]# cd /usr/local/src/
[root@node4 src]# cd nginx-1.16.1
[root@node4 nginx-1.16.1]# ./configure --prefix=/usr/local/nginx --with-http_stub_status_module
[root@node4 nginx-1.16.1]# make && make install
[root@node4 nginx-1.16.1]# nginx -V
configure arguments: --prefix=/usr/local/nginx --with-http_stub_status_module
3.2 配置文件添加状态
nginx的配置文件添加
[root@node4 nginx-1.16.1]# grep -Ev "^$|#" /usr/local/nginx/conf/nginx.conf
worker_processes  1;
events {
    worker_connections  1024;
}
http {
    include       mime.types;
    default_type  application/octet-stream;
    sendfile        on;
    keepalive_timeout  65;
    server {
        listen       80;
        server_name  localhost;
    location /nginx-status{
        stub_status on;
        access_log off;
    }
        location / {
            root   html;
            index  index.html index.htm;
        }
        error_page   500 502 503 504  /50x.html;
        location = /50x.html {
            root   html;
        }
    }
}
[root@node4 nginx-1.16.1]# nginx -t
nginx: the configuration file /usr/local/nginx/conf/nginx.conf syntax is ok
nginx: configuration file /usr/local/nginx/conf/nginx.conf test is successful
3.3 访问测试
[root@node4 nginx-1.16.1]# nginx -s reload
访问http://192.168.132.134/nginx-status

3.4 结果说明
Active connections:正在处理的活动连接数
server accepts handled requests
- 第一个 server表示 Nginx启动到现在共处理了6个连接
- 第二个 accepts表示Ngin启动到现在共成功创建6次握手
- 第三个 handled requests表示总共处理了21次请求
- 请求丢失数=握手数·连接数,可以看出目前为止没有丢失请求
Reading: 0 Writing: 1 Waiting: 1
- Reading: Nginx读取到客户端的 Header信息数
- Writing: Nginx返回给客户端 Header信息数
- Waiting: Nginx已经处理完正在等候下一次请求指令的驻留链接(开启 keep-alive的情况下,这个值等于Active(Reading+Writing)
3.5 启动nginx的module
[root@node4 nginx-1.16.1]# cd /usr/local/metricbeat/
[root@node4 metricbeat]# ./metricbeat modules enable nginx
Enabled nginx
[root@node4 metricbeat]# ll modules.d/

[root@node4 metricbeat]# vi modules.d/nginx.yml
# Module: nginx
# Docs: https://www.elastic.co/guide/en/beats/metricbeat/7.4/metricbeat-module-nginx.html

- module: nginx
  #metricsets:
  #  - stubstatus
  period: 10s

  # Nginx hosts
  #hosts: ["http://127.0.0.1"]
  hosts: ["http://192.168.132.134"]
  # Path to server status. Default server-status
  #server_status_path: "server-status"
  server_status_path: "server-status"

  #username: "user"
  #password: "secret"
再次启动
[root@node4 metricbeat]# ./metricbeat -e
3.6 查看配置结果


原始数据
{
"_index": "metricbeat-7.4.2-2019.11.25-000001",
"_type": "_doc",
"_id": "ba0oo24BcnOPLK2rVzUH",
"_version": 1,
"_score": 1,
"_source": {
"@timestamp": "2019-11-25T15:22:39.039Z",
"metricset": {
"period": 10000,
"name": "stubstatus"
},
"service": {
"address": "192.168.132.134",
"type": "nginx"
},
"event": {
"dataset": "nginx.stubstatus",
"module": "nginx",
"duration": 871562
},
"nginx": {
"stubstatus": {
"current": 151,
"hostname": "192.168.132.134",
"accepts": 13,
"handled": 13,
"dropped": 0,
"requests": 151,
"writing": 1,
"reading": 0,
"waiting": 0,
"active": 1
}
},
"ecs": {
"version": "1.1.0"
},
"host": {
"name": "node4",
"id": "a833bbe7e3634c75ab1b427c4049d056",
"containerized": false,
"hostname": "node4",
"architecture": "x86_64",
"os": {
"version": "7 (Core)",
"family": "redhat",
"name": "CentOS Linux",
"kernel": "3.10.0-957.27.2.el7.x86_64",
"codename": "Core",
"platform": "centos"
}
},
"agent": {
"id": "6abe64f1-2aa7-483a-8b23-2dd8e3cf4972",
"version": "7.4.2",
"type": "metricbeat",
"ephemeral_id": "35503dcb-9f11-4e23-9e07-9dd520ecdb14",
"hostname": "node4"
}
}
}
nginx的metriabeat已经配置完成,后面继续完成ngxin这一部分配置