一般很常见的柱状图,大家都想到用百度echart,如果整个项目就只绘制仅有的一个柱状图,引入echart就有点大材小用了,哈哈哈。
预览地址:https://zuobaiquan.github.io/vue/vueExercise/vue-test/dist/index.html#/bargraph
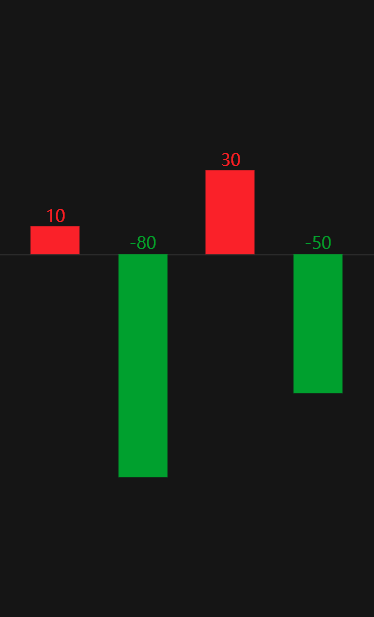
效果图
代码显示如下:
<template>
    <div class="line-chart">
      <ul>
        <li v-for="(item,index) in dataListArr" :class="item.number>0?'':'position-top'">
          <div class="box" :style="{height:item.percentNum*10+'rem'}">
            <span class="num">{{item.number}}</span>
          </div>
        </li>
      </ul>
    </div>
</template>
export default {
  name: 'test',
  data(){
    return {
      dataListArr:[
        {'number':10,'percentNum':0},
        {'number':-80,'percentNum':0},
        {'number':30,'percentNum':0},
        {'number':-50,'percentNum':0}
      ]
    }
  },
  created(){
    let maxIndex=0,maxNegative=0,maxPositive=0;
    this.dataListArr.forEach(function(v,i){
      if (Math.abs(v.number)<=Math.abs(v.number)){
        maxIndex=i;
      }
      if((v.number>0)&&(v.number>maxPositive)){
        maxPositive=v.number;
      }
      if((v.number<0)&&(v.number<maxNegative)){
        maxNegative=v.number;
      }
    });
    this.$nextTick(function () {
      document.querySelector('.line-chart').style.marginTop=-(maxPositive-maxNegative)/20+'rem';
    })
    let maxnumber=Math.abs(this.dataListArr[maxIndex].number);
    setTimeout(function(){
      this.dataListArr.forEach(function(value,index){
          value.percentNum=Math.abs(value.number)/maxnumber;
      });
      console.log(this.dataListArr);
    }.bind(this),0)

  }
}
$red: #f22323 !default;
$green: #00a000 !default;
$borderColor: #262626 !default;
body{
  background: #0d0d0d;
}
.line-chart{
  position:absolute;
  top:50%;
  left:0;
  right:0;
  height: 0.05rem;
  background: $borderColor;
  border-bottom: 1px solid $borderColor;
  transform: translateY(-50%);
  ul{
    display: flex;
    justify-content: space-between;
    margin: 0 4rem;
    li{
      text-align: center;
      list-style: none;
      .box{
        position: absolute;
        bottom:0;
        width: 3.5rem;
        height: 0;
        background: $red;
        text-align: center;
        transform: translateX(-50%);
        transition:  height 1s;
        .num{
          position: absolute;
          top:-1.4rem;
          left:0;
          right: 0;
          display: inline-block;
          color: $red;
          font-weight: 500;
          font-size: 1.2rem;
          line-height: 1;
        }
      }
      &.position-top{
        .box{
          top:0;
          background: $green;
          .num{
            color: $green;
          }
        }
      }
    }
  }
}
源码地址 https://github.com/zuobaiquan/vue/tree/master/vueExercise/vue-test/src/views/bargraph