Python-Matplotlib 5 条形图
Example 1
import numpy as np
import matplotlib.pyplot as plt

N = 5
y = [20, 10, 30, 25, 15]
index = np.arange(5)
print(index)
#p1 = plt.bar(left=index, height=y)
#p1 = plt.bar(left=index, height=y, color='red',width=0.5,)

# orientation='horizontal'
p1 = plt.bar(left=0,bottom=index , width=y, color='yellow',height=0.5, orientation='horizontal')
plt.show()
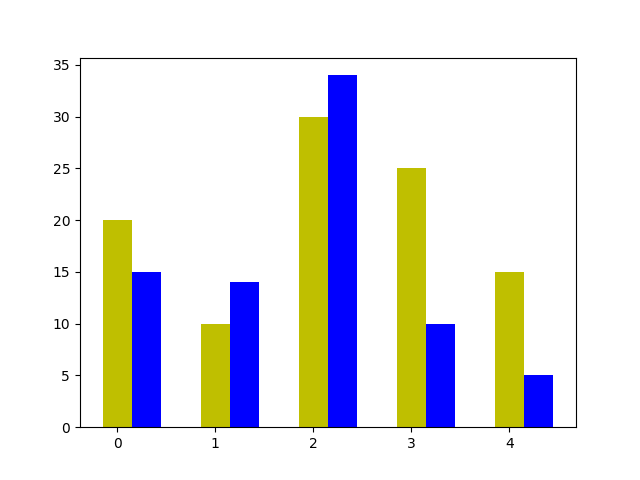
Example 2
import numpy as np
import matplotlib.pyplot as plt

N = 5
y1 = [20, 10, 30, 25, 15]
y2 = [15, 14, 34 ,10,5]
index = np.arange(5)

bar_width = 0.3
plt.bar(index , y1, width=0.3 , color='y')
plt.bar(index +  bar_width, y2, width=0.3 , color='b')
plt.show()
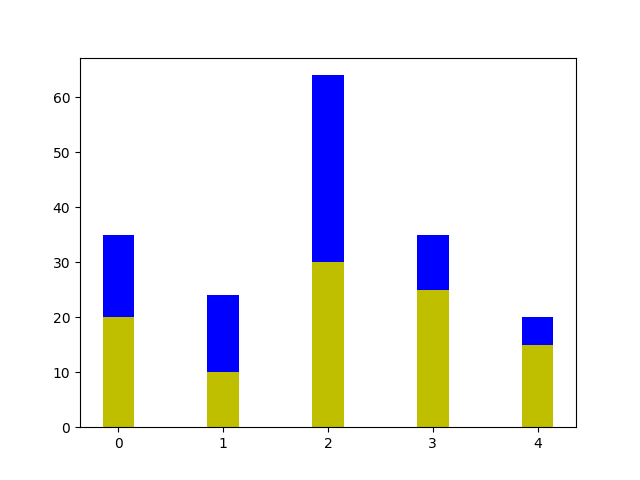
Example 3
import numpy as np
import matplotlib.pyplot as plt

N = 5
y1 = [20, 10, 30, 25, 15]
y2 = [15, 14, 34 ,10,5]
index = np.arange(5)

bar_width = 0.3
plt.bar(index , y1, width=0.3 , color='y')
plt.bar(index , y2, width=0.3 , color='b' ,bottom=y1)
plt.show()