opencv基于PCA降维算法的人脸识别(att_faces)
一、数据提取与处理
# 导入所需模块
import matplotlib.pyplot as plt
import numpy as np
import os
import cv2
# plt显示灰度图片
def plt_show(img):
    plt.imshow(img,cmap='gray')
    plt.show()
# 读取一个文件夹下的所有图片,输入参数是文件名,返回文件地址列表
def read_directory(directory_name):
    faces_addr = []
    for filename in os.listdir(directory_name):
        faces_addr.append(directory_name + "/" + filename)
    return faces_addr
# 读取所有人脸文件夹,保存图像地址在列表中
faces = []
for i in range(1,42):
    faces_addr = read_directory('./att_faces/s'+str(i))
    for addr in faces_addr:
        faces.append(addr)
# 读取图片数据,生成列表标签
images = []
labels = []
for index,face in enumerate(faces):
    image = cv2.imread(face,0)
    images.append(image)
    labels.append(int(index/10+1))
print(len(labels))
print(len(images))
print(type(images[0]))
print(labels)
410
410
<class 'numpy.ndarray'>
[1, 1, 1, 1, 1, 1, 1, 1, 1, 1, 2, 2, 2, 2, 2, 2, 2, 2, 2, 2, 3, 3, 3, 3, 3, 3, 3, 3, 3, 3, 4, 4, 4, 4, 4, 4, 4, 4, 4, 4, 5, 5, 5, 5, 5, 5, 5, 5, 5, 5, 6, 6, 6, 6, 6, 6, 6, 6, 6, 6, 7, 7, 7, 7, 7, 7, 7, 7, 7, 7, 8, 8, 8, 8, 8, 8, 8, 8, 8, 8, 9, 9, 9, 9, 9, 9, 9, 9, 9, 9, 10, 10, 10, 10, 10, 10, 10, 10, 10, 10, 11, 11, 11, 11, 11, 11, 11, 11, 11, 11, 12, 12, 12, 12, 12, 12, 12, 12, 12, 12, 13, 13, 13, 13, 13, 13, 13, 13, 13, 13, 14, 14, 14, 14, 14, 14, 14, 14, 14, 14, 15, 15, 15, 15, 15, 15, 15, 15, 15, 15, 16, 16, 16, 16, 16, 16, 16, 16, 16, 16, 17, 17, 17, 17, 17, 17, 17, 17, 17, 17, 18, 18, 18, 18, 18, 18, 18, 18, 18, 18, 19, 19, 19, 19, 19, 19, 19, 19, 19, 19, 20, 20, 20, 20, 20, 20, 20, 20, 20, 20, 21, 21, 21, 21, 21, 21, 21, 21, 21, 21, 22, 22, 22, 22, 22, 22, 22, 22, 22, 22, 23, 23, 23, 23, 23, 23, 23, 23, 23, 23, 24, 24, 24, 24, 24, 24, 24, 24, 24, 24, 25, 25, 25, 25, 25, 25, 25, 25, 25, 25, 26, 26, 26, 26, 26, 26, 26, 26, 26, 26, 27, 27, 27, 27, 27, 27, 27, 27, 27, 27, 28, 28, 28, 28, 28, 28, 28, 28, 28, 28, 29, 29, 29, 29, 29, 29, 29, 29, 29, 29, 30, 30, 30, 30, 30, 30, 30, 30, 30, 30, 31, 31, 31, 31, 31, 31, 31, 31, 31, 31, 32, 32, 32, 32, 32, 32, 32, 32, 32, 32, 33, 33, 33, 33, 33, 33, 33, 33, 33, 33, 34, 34, 34, 34, 34, 34, 34, 34, 34, 34, 35, 35, 35, 35, 35, 35, 35, 35, 35, 35, 36, 36, 36, 36, 36, 36, 36, 36, 36, 36, 37, 37, 37, 37, 37, 37, 37, 37, 37, 37, 38, 38, 38, 38, 38, 38, 38, 38, 38, 38, 39, 39, 39, 39, 39, 39, 39, 39, 39, 39, 40, 40, 40, 40, 40, 40, 40, 40, 40, 40, 41, 41, 41, 41, 41, 41, 41, 41, 41, 41]
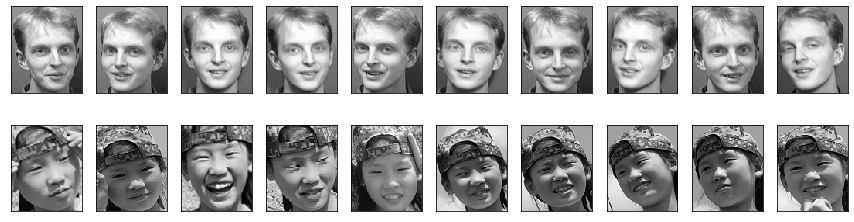
# 画出最后两组人脸图像
#创建画布和子图对象
fig, axes = plt.subplots(2,10
                       ,figsize=(15,4)
                       ,subplot_kw = {"xticks":[],"yticks":[]} #不要显示坐标轴
                       )
#填充图像
for i, ax in enumerate(axes.flat):
    ax.imshow(images[i+390],cmap="gray") #选择色彩的模式
二、PCA降低维度
# 图像数据转换特征矩阵
image_data = []
for image in images:
    data = image.flatten()
    image_data.append(data)
print(image_data[0].shape)
(10304,)
# 转换为numpy数组
X = np.array(image_data)
y = np.array(labels)
print(type(X))
print(X.shape)
<class 'numpy.ndarray'>
(410, 10304)
PCA变换原理。在人脸识别过程中,一般把图片看成是向量进行处理,高等数学中我们接触的一般都是二维或三维向量,向量的维数是根据组成向量的变量个数来定的,例如就是一个二维向量,因为其有两个参量。而在将一幅图像抽象为一个向量的过程中,我们把图像的每个像素定为一维,对于一幅的普通图像来说,最后抽象为一个维的高维向量,如此庞大的维数对于后续图像计算式来说相当困难,因此有必要在尽可能不丢失重要信息的前提下降低图像维数,PCA就是降低图像维数的一种方法。图像在经过PCA变换之后,可以保留任意数量的对图像特征贡献较大的维数分量,也就是你可以选择降维到30维或者90维或者其他,当然最后保留的维数越多,图像丢失的信息越少,但计算越复杂。
参考博客:https://blog.csdn.net/qq_37791134/article/details/81387813
# 导入sklearn的pca模块
from sklearn.decomposition import PCA
from sklearn.model_selection import train_test_split
# 画出特征矩阵
import pandas as pd
data = pd.DataFrame(X)
data.head()
| 0 | 1 | 2 | 3 | 4 | 5 | 6 | 7 | 8 | 9 | ... | 10294 | 10295 | 10296 | 10297 | 10298 | 10299 | 10300 | 10301 | 10302 | 10303 | |
|---|---|---|---|---|---|---|---|---|---|---|---|---|---|---|---|---|---|---|---|---|---|
| 0 | 48 | 49 | 45 | 47 | 49 | 57 | 39 | 42 | 53 | 49 | ... | 39 | 44 | 40 | 41 | 49 | 42 | 44 | 47 | 46 | 46 |
| 1 | 34 | 34 | 33 | 32 | 38 | 40 | 39 | 49 | 54 | 57 | ... | 42 | 44 | 38 | 30 | 37 | 30 | 36 | 37 | 40 | 33 |
| 2 | 60 | 60 | 62 | 53 | 48 | 51 | 61 | 60 | 71 | 68 | ... | 27 | 35 | 28 | 33 | 31 | 31 | 37 | 32 | 34 | 34 |
| 3 | 39 | 44 | 53 | 37 | 61 | 48 | 61 | 45 | 35 | 40 | ... | 23 | 30 | 36 | 32 | 28 | 32 | 31 | 29 | 26 | 29 |
| 4 | 63 | 53 | 35 | 36 | 33 | 34 | 31 | 35 | 39 | 43 | ... | 173 | 169 | 166 | 161 | 158 | 169 | 137 | 41 | 10 | 24 |
5 rows × 10304 columns
# 划分数据集
x_train,x_test,y_train,y_test = train_test_split(X, y, test_size=0.2)
# 训练PCA模型
pca=PCA(n_components=100)
pca.fit(x_train)
PCA(copy=True, iterated_power='auto', n_components=100, random_state=None,
    svd_solver='auto', tol=0.0, whiten=False)
# 返回测试集和训练集降维后的数据集
x_train_pca = pca.transform(x_train)
x_test_pca = pca.transform(x_test)
print(x_train_pca.shape)
print(x_test_pca.shape)
(328, 100)
(82, 100)
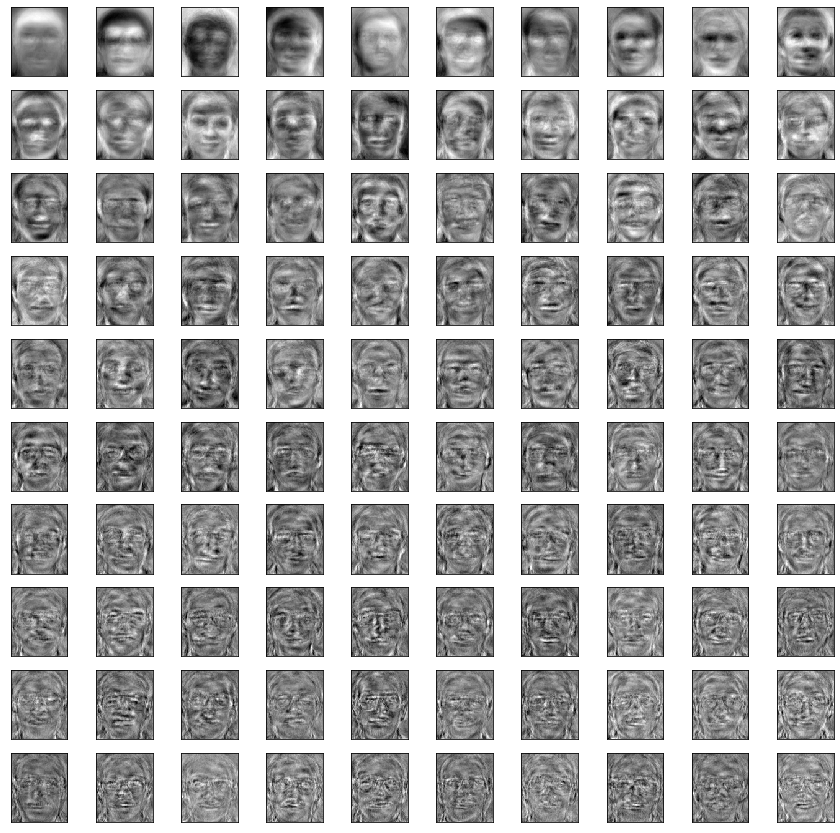
V = pca.components_
V.shape
(100, 10304)
# 100个特征脸
#创建画布和子图对象
fig, axes = plt.subplots(10,10
                       ,figsize=(15,15)
                       ,subplot_kw = {"xticks":[],"yticks":[]} #不要显示坐标轴
                       )
#填充图像
for i, ax in enumerate(axes.flat):
    ax.imshow(V[i,:].reshape(112,92),cmap="gray") #选择色彩的模式
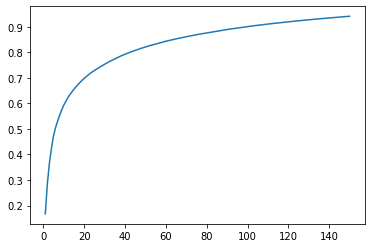
# 改选择多少个特征呢?
#属性explained_variance_ratio,查看降维后每个新特征向量所占的信息量占原始数据总信息量的百分比
#又叫做可解释方差贡献率
pca.explained_variance_ratio_
array([0.16754406, 0.11712118, 0.08050592, 0.05800583, 0.04899411,
       0.03236304, 0.02552568, 0.02246334, 0.02105942, 0.01869678,
       0.01492577, 0.01452819, 0.01195689, 0.01106418, 0.01061136,
       0.00920361, 0.00893044, 0.00841665, 0.00815548, 0.00745415,
       0.00684847, 0.00674609, 0.00641437, 0.00555017, 0.00533678,
       0.00511044, 0.00498169, 0.00493545, 0.00477643, 0.0046901 ,
       0.00452947, 0.00443995, 0.00424948, 0.00415627, 0.00402244,
       0.00391703, 0.00380438, 0.00365518, 0.00347555, 0.00338822,
       0.00325   , 0.00306806, 0.00305956, 0.00297671, 0.00286721,
       0.00281228, 0.00272433, 0.00266031, 0.00257338, 0.00251557,
       0.00247235, 0.00243605, 0.00236254, 0.00232992, 0.00225821,
       0.00221418, 0.00217406, 0.00213639, 0.00203163, 0.00199645,
       0.00194659, 0.00193678, 0.00187899, 0.00186114, 0.00181597,
       0.00178071, 0.0017298 , 0.00171467, 0.00166234, 0.00163148,
       0.00160447, 0.00157375, 0.00155019, 0.00154325, 0.00152017,
       0.00149426, 0.00147426, 0.00145617, 0.00143343, 0.00140277,
       0.00138425, 0.00135825, 0.00134036, 0.00133259, 0.00129024,
       0.00126753, 0.00124071, 0.00123078, 0.00121395, 0.00119294,
       0.00116697, 0.00115547, 0.00111406, 0.00111104, 0.00109964,
       0.00107608, 0.00106702, 0.00105275, 0.00102797, 0.00100745])
# 返回特征所携带的数据是原始数据的多少
pca.explained_variance_ratio_.sum()
0.9002145083699277
# 画出特征个数和所携带信息数的曲线图
explained_variance_ratio = []
for i in range(1,151):
    pca=PCA(n_components=i).fit(x_train)
    explained_variance_ratio.append(pca.explained_variance_ratio_.sum())
plt.plot(range(1,151),explained_variance_ratio)
plt.show()
三、使用OpenCV的EigenFace算法进行识别
原理:将训练集图像和测试集图像都投影到特征向量空间中,再使用聚类方法(最近邻或k近邻等)得到里测试集中的每个图像最近的图像,进行分类即可。
cv2.face.EigenFaceRecognizer_create()创建人脸识别的模型,通过图像数组和对应标签数组来训练模型
predict()函数进行人脸预测,该函数会返回两个元素的数组
- 第一个是识别个体的标签,
- 第二个是置信度,越小匹配度越高,0表示完全匹配。
getEigenValues() 获得特征值
getEigenVectors() 特征向量
getMean() 均值
# 模型创建与训练
model = cv2.face.EigenFaceRecognizer_create()
model.train(x_train,y_train)
# 预测
res = model.predict(x_test[0])
print(res)
(6, 1786.5044335243144)
y_test[0]
6
# 测试数据集的准确率
ress = []
true = 0
for i in range(len(y_test)):
    res = model.predict(x_test[i])
#     print(res[0])
    if y_test[i] == res[0]:
        true = true+1
    else:
        print(i)

print('测试集识别准确率:%.2f'% (true/len(y_test)))
8
35
测试集识别准确率:0.98
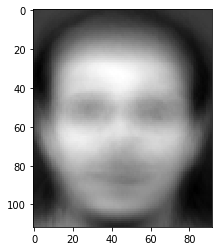
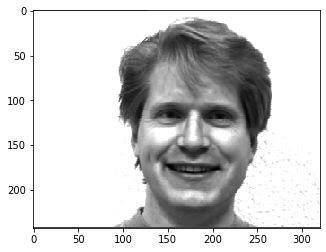
# 平均脸
mean = model.getMean()
print(mean)
meanFace = mean.reshape(112,92)
plt_show(meanFace)
[[86.65243902 86.85670732 87.47865854 ... 77.02134146 76.27439024
  75.65243902]]
四、自定义图片测试
# 降维
pca=PCA(n_components=100)
pca.fit(X)
X = pca.transform(X)
# 将所有数据都用作训练集
# 模型创建与训练
model = cv2.face.EigenFaceRecognizer_create()
model.train(X,y)
# plt显示彩色图片
def plt_show0(img):
    b,g,r = cv2.split(img)
    img = cv2.merge([r, g, b])
    plt.imshow(img)
    plt.show()
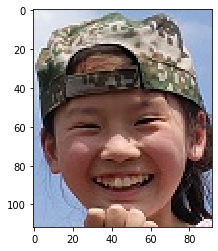
# 输入图片识别
img = cv2.imread('./att_faces/test.jpg')
plt_show0(img)
print(img.shape)
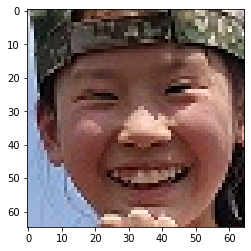
# 灰度处理
img = cv2.imread('./att_faces/test.jpg',0)
plt_show(img)
imgs = []
imgs.append(img)
# 特征矩阵
image_data = []
for img in imgs:
    data = img.flatten()
    image_data.append(data)
test = np.array(image_data)
test.shape
(1, 10304)
# 用训练好的pca模型给图片降维
test = pca.transform(test)
test[0].shape
(100,)
res = model.predict(test)
res
(41, 4308.711798033283)
print('人脸识别结果:',res[0])
人脸识别结果: 41
五、OpenCV中的简单人脸检测
# 加载人脸检测模型
face_engine = cv2.CascadeClassifier(cv2.data.haarcascades+'haarcascade_frontalface_default.xml')
img = cv2.imread('./image/image.jpg')
plt_show0(img)

# 复制图像灰度处理
img_ = img.copy()
gray = cv2.cvtColor(img, cv2.COLOR_RGB2GRAY)
# 检测人脸获取人脸区域
faces = face_engine.detectMultiScale(gray)
# 将检测出的人脸可视化
for(x, y, w, h) in faces:
    cv2.rectangle(img_, (x, y), (x + w, y + h), (0, 0, 255), 3)
    plt_show0(img_)
    face = img[y:y + w, x:x + h]
    plt_show0(face)
总结
可使用人脸检测得到图片,在对图片进行其他的一些操作,在进行人脸识别,特别注意尺寸要和训练的图片一致
项目可以更加完善,但pca降维算法在实际的使用中非常有效,一定要掌握与使用
备注:
- 基于sklearn中pca算法和OpenCV特征脸算法的人脸识别项目
- 2020-4-28
- 曾强
opencv基于PCA降维算法的人脸识别(yalefaces)
from sklearn.decomposition import PCA
import matplotlib.pyplot as plt
import numpy as np
import os
import cv2
import imageio
# plt显示灰度图片
def plt_show(img):
    plt.imshow(img,cmap='gray')
    plt.show()
nameList = ['01','02','03','04','05','06','07','08','09','10','11','12','13','14','15']
characteristic = ['centerlight','glasses','happy','leftlight','noglasses','rightlight','sad','sleepy','surprised','wink']
faces = []
for name in nameList:
    for character in characteristic:
        src = './yalefaces/faces/subject'+ name +'.'+character
        img = imageio.imread(src)
        faces.append(img)
len(faces)
150
labels = []
for name in nameList:
    for i in range(10):
        labels.append(int(name))
len(labels)
150
image_data = []
for image in faces:
    data = image.flatten()
    image_data.append(data)
X = np.array(image_data)
y = np.array(labels)
X.shape
(150, 77760)
from sklearn.decomposition import PCA
from sklearn.model_selection import train_test_split
import pandas as pd
data = pd.DataFrame(X)
data.head()
| 0 | 1 | 2 | 3 | 4 | 5 | 6 | 7 | 8 | 9 | ... | 77750 | 77751 | 77752 | 77753 | 77754 | 77755 | 77756 | 77757 | 77758 | 77759 | |
|---|---|---|---|---|---|---|---|---|---|---|---|---|---|---|---|---|---|---|---|---|---|
| 0 | 130 | 130 | 130 | 130 | 130 | 130 | 130 | 130 | 130 | 130 | ... | 68 | 68 | 68 | 68 | 68 | 68 | 68 | 68 | 68 | 68 |
| 1 | 130 | 130 | 130 | 130 | 130 | 130 | 130 | 130 | 130 | 130 | ... | 68 | 68 | 68 | 68 | 68 | 68 | 68 | 68 | 68 | 68 |
| 2 | 130 | 130 | 130 | 130 | 130 | 130 | 130 | 130 | 130 | 130 | ... | 68 | 68 | 68 | 68 | 68 | 68 | 68 | 68 | 68 | 68 |
| 3 | 130 | 130 | 130 | 130 | 130 | 130 | 130 | 130 | 130 | 129 | ... | 68 | 68 | 68 | 68 | 68 | 68 | 68 | 68 | 68 | 68 |
| 4 | 130 | 130 | 130 | 130 | 130 | 130 | 130 | 130 | 130 | 130 | ... | 68 | 68 | 68 | 68 | 68 | 68 | 68 | 68 | 68 | 68 |
5 rows × 77760 columns
x_train,x_test,y_train,y_test = train_test_split(X, y, test_size=0.2)
y_test
array([13, 12,  9,  7, 15,  9,  3,  5, 12,  9,  5, 13,  1, 10, 12, 13,  9,
        6, 12,  6,  1,  2,  6,  1,  7,  2,  8,  1,  3, 12])
#先训练PCA模型
pca=PCA(n_components=60)
pca.fit(x_train)
PCA(copy=True, iterated_power='auto', n_components=60, random_state=None,
    svd_solver='auto', tol=0.0, whiten=False)
# 返回测试集和训练集降维后的数据集
x_train_pca = pca.transform(x_train)
x_test_pca = pca.transform(x_test)
print(x_train_pca.shape)
print(x_test_pca.shape)
(120, 60)
(30, 60)
pca.explained_variance_
array([1.08422936e+08, 4.66350537e+07, 3.07918180e+07, 2.64046838e+07,
       1.75413992e+07, 1.60852267e+07, 9.78916417e+06, 7.52160385e+06,
       6.88799618e+06, 6.66114015e+06, 4.63862806e+06, 3.90812976e+06,
       3.48376116e+06, 3.18737747e+06, 3.06254146e+06, 2.75505745e+06,
       2.67162174e+06, 2.40860869e+06, 2.29132186e+06, 1.99029494e+06,
       1.91040434e+06, 1.62767018e+06, 1.51547238e+06, 1.41752277e+06,
       1.37872739e+06, 1.28054296e+06, 1.15090468e+06, 1.10293253e+06,
       1.06338859e+06, 1.02508177e+06, 9.37512997e+05, 8.71844988e+05,
       8.27272967e+05, 8.00608330e+05, 7.86361786e+05, 7.62182396e+05,
       7.22127119e+05, 7.14440493e+05, 6.70731109e+05, 6.51273242e+05,
       6.44085041e+05, 6.38427776e+05, 5.90752701e+05, 5.67930714e+05,
       5.50766567e+05, 5.43246428e+05, 5.25706169e+05, 5.15642292e+05,
       4.87835392e+05, 4.64595068e+05, 4.60028444e+05, 4.52881987e+05,
       4.39019101e+05, 4.32071261e+05, 4.29244698e+05, 4.04887637e+05,
       3.95972004e+05, 3.84714305e+05, 3.61548759e+05, 3.50453433e+05])
pca.explained_variance_ratio_
array([0.31160122, 0.13402643, 0.0884939 , 0.07588553, 0.05041296,
       0.04622801, 0.02813349, 0.02161665, 0.0197957 , 0.01914373,
       0.01333115, 0.01123174, 0.01001213, 0.00916034, 0.00880157,
       0.00791787, 0.00767809, 0.0069222 , 0.00658513, 0.00571999,
       0.00549039, 0.00467783, 0.00435538, 0.00407388, 0.00396238,
       0.00368021, 0.00330763, 0.00316976, 0.00305612, 0.00294603,
       0.00269436, 0.00250563, 0.00237753, 0.0023009 , 0.00225996,
       0.00219047, 0.00207535, 0.00205326, 0.00192764, 0.00187172,
       0.00185106, 0.0018348 , 0.00169779, 0.0016322 , 0.00158287,
       0.00156126, 0.00151085, 0.00148193, 0.00140201, 0.00133522,
       0.0013221 , 0.00130156, 0.00126172, 0.00124175, 0.00123362,
       0.00116362, 0.001138  , 0.00110565, 0.00103907, 0.00100718])
pca.explained_variance_ratio_.sum()
0.9713784954856973
X_tr = x_train_pca
y_tr = y_train
X_te = x_test_pca
y_te = y_test
print(len(X_tr))
print(len(y_te))
120
30
model = cv2.face.EigenFaceRecognizer_create()
model.train(X_tr,y_tr)
res = model.predict(X_te[29])
print(res)
(12, 6619.150897246195)
y_te[29]
12
ress = []
true = 0
for i in range(len(X_te)):
    res = model.predict(X_te[i])
#     print(res[0])
    if y_te[i] == res[0]:
        true = true+1
    else:
        print(i)

print('测试集识别准确率:%.2f'% (true/len(y_te)))
0
12
17
20
27
28
测试集识别准确率:0.80
# 输入图片识别
normal_image = []
for name in nameList:
    img = imageio.imread('./yalefaces/faces/subject'+name+'.normal')
    normal_image.append(img)
normal_image_data = []
for image in normal_image:
    data = image.flatten()
    normal_image_data.append(data)
normal = pca.transform(normal_image_data)
normal.shape
(15, 60)
res = model.predict(normal[14])
res
(15, 8895.523222370097)
img_ = imageio.imread('./yalefaces/faces/subject01.happy')
# img_ = cv2.cvtColor(img_,cv2.COLOR_BGR2GRAY)
plt_show(img_)
img = imageio.imread('./yalefaces/test2.gif')
img = cv2.cvtColor(img,cv2.COLOR_BGR2GRAY)
plt_show(img)
imgs = []
imgs.append(img)
imgs[0].shape
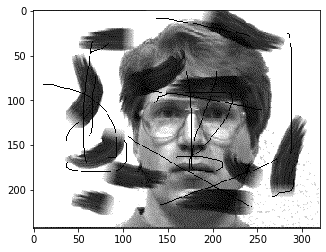
(243, 320)
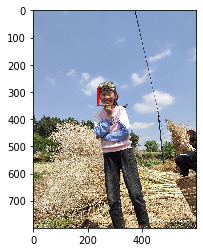
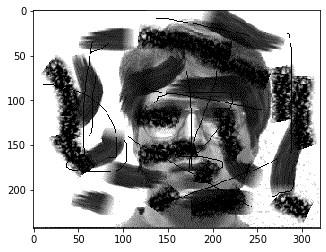
img = imageio.imread('./yalefaces/test3.gif')
img = cv2.cvtColor(img,cv2.COLOR_BGR2GRAY)
plt_show(img)
imgs = []
imgs.append(img)
imgs[0].shape
test_img = []
for image in imgs:
    data = image.flatten()
    test_img.append(data)
test = pca.transform(test_img)
res = model.predict(test)
res
(2, 19431.70881247637)
源码地址:
链接:https://pan.baidu.com/s/1yAG7R0AoxaUvF5k6EuUaQQ
提取码:huhr