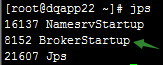
1. jps 获取要监控broker jvm 的进程ID
jsp
2. nohup 输出监控日志
nohup jstat -gc -t [pid] [interval]
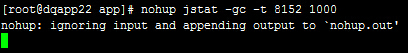
-t 会在每一条记录前加时间戳,执行命令间隔interval(毫秒)
3. 想要结束监控时Ctrl+C

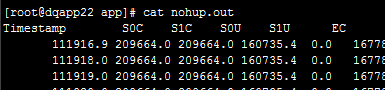
4. 查看日志
cat nohup.out
5. 获取进程开始时间
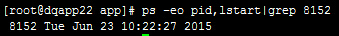
6. 将时间转成timestamp 同日志中的时间相加转成当前时间(日志中单位s)
例如查看第三条记录执行时间
public static void main(String[] args) throws ParseException {
        DateFormat df = new SimpleDateFormat("yyyy-MM-dd hh:mm:ss");
        Date date = df.parse("2015-06-23 10:22:27");
        Calendar c = Calendar.getInstance();
        c.setTimeInMillis(date.getTime() + 111919 * 1000);

        System.out.println(c.getTime());
    }
结果:
Wed Jun 24 17:27:46 CST 2015
7. 分析日志中内存使用及垃圾回收情况
| Timestamp | S0C | S1C | S0U | S1U | EC | EU | OC | OU | PC | PU | YGC | YGCT | FGC | FGCT | GCT |
| 111916.9 | 209664.0 | 209664.0 | 160735.4 | 0.0 | 1677824.0 | 100273.5 | 2097152.0 | 898708.6 | 131072.0 | 15537.9 | 68 | 15.477 | 0 | 0.000 | 15.477 |
Garbage-collected heap statistics.
Timestamp: Timestamp (s).
S0C Current survivor space 0 capacity (KB).
S1C Current survivor space 1 capacity (KB).
S0U Survivor space 0 utilization (KB).
S1U Survivor space 1 utilization (KB).
EC Current eden space capacity (KB).
EU Eden space utilization (KB).
OC Current old space capacity (KB).
OU Old space utilization (KB).
PC Current permanent space capacity (KB).
PU Permanent space utilization (KB).
YGC Number of young generation GC Events.
YGCT Young generation garbage collection time.
FGC Number of full GC events.
FGCT Full garbage collection time.
GCT Total garbage collection time.