前期博客
基于CentOS6.5下Suricata(一款高性能的网络IDS、IPS和网络安全监控引擎)的搭建(图文详解)(博主推荐)
基于Ubuntu14.04下Suricata(一款高性能的网络IDS、IPS和网络安全监控引擎)的搭建(图文详解)(博主推荐)
参考官网
https://redmine.openinfosecfoundation.org/projects/suricata/wiki/_Logstash_Kibana_and_Suricata_JSON_output
注意,这官网,默认是适合Ubuntu系统的安装手法。
首先,
Make sure your Suricata is compiled/installed with libjansson support enabled:
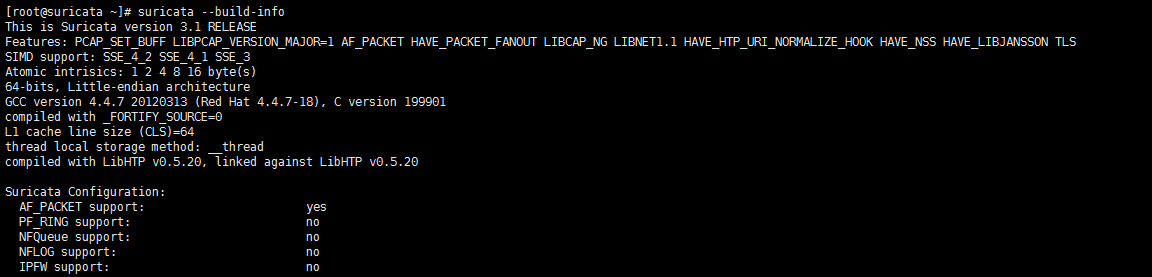
[root@suricata ~]# suricata --build-info
This is Suricata version 3.1 RELEASE
Features: PCAP_SET_BUFF LIBPCAP_VERSION_MAJOR=1 AF_PACKET HAVE_PACKET_FANOUT LIBCAP_NG LIBNET1.1 HAVE_HTP_URI_NORMALIZE_HOOK HAVE_NSS HAVE_LIBJANSSON TLS
SIMD support: SSE_4_2 SSE_4_1 SSE_3
Atomic intrisics: 1 2 4 8 16 byte(s)
64-bits, Little-endian architecture
GCC version 4.4.7 20120313 (Red Hat 4.4.7-18), C version 199901
compiled with _FORTIFY_SOURCE=0
L1 cache line size (CLS)=64
thread local storage method: __thread
compiled with LibHTP v0.5.20, linked against LibHTP v0.5.20

Suricata Configuration:
  AF_PACKET support:                       yes
  PF_RING support:                         no
  NFQueue support:                         no
  NFLOG support:                           no
  IPFW support:                            no
  Netmap support:                          no
  DAG enabled:                             no
  Napatech enabled:                        no

  Unix socket enabled:                     yes
  Detection enabled:                       yes

  libnss support:                          yes
  libnspr support:                         yes
  libjansson support:                      yes
  hiredis support:                         no
  Prelude support:                         no
  PCRE jit:                                no
  LUA support:                             no
  libluajit:                               no
  libgeoip:                                no
  Non-bundled htp:                         no
  Old barnyard2 support:                   no
  CUDA enabled:                            no
  Hyperscan support:                       no
  Libnet support:                          yes

  Suricatasc install:                      yes

  Profiling enabled:                       no
  Profiling locks enabled:                 no

Development settings:
  Coccinelle / spatch:                     no
  Unit tests enabled:                      no
  Debug output enabled:                    no
  Debug validation enabled:                no

Generic build parameters:
  Installation prefix:                     /usr/local
  Configuration directory:                 /usr/local/etc/suricata/
  Log directory:                           /usr/local/var/log/suricata/

  --prefix                                 /usr/local
  --sysconfdir                             /usr/local/etc
  --localstatedir                          /usr/local/var

  Host:                                    x86_64-pc-linux-gnu
  Compiler:                                gcc (exec name) / gcc (real)
  GCC Protect enabled:                     no
  GCC march native enabled:                yes
  GCC Profile enabled:                     no
  Position Independent Executable enabled: no
  CFLAGS                                   -g -O2 -march=native
  PCAP_CFLAGS
  SECCFLAGS
[root@suricata ~]#
然后,需要配置
Configure suricata
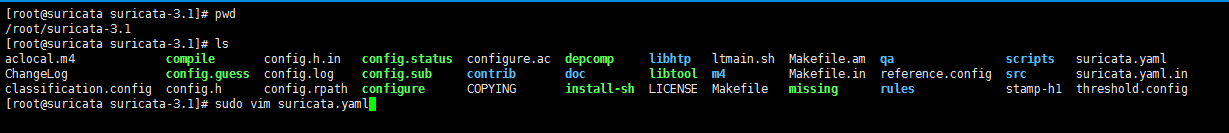
[root@suricata suricata-3.1]# pwd
/root/suricata-3.1
[root@suricata suricata-3.1]# ls
aclocal.m4             compile       config.h.in   config.status  configure.ac  depcomp     libhtp   ltmain.sh  Makefile.am  qa                scripts   suricata.yaml
ChangeLog              config.guess  config.log    config.sub     contrib       doc         libtool  m4         Makefile.in  reference.config  src       suricata.yaml.in
classification.config  config.h      config.rpath  configure      COPYING       install-sh  LICENSE  Makefile   missing      rules             stamp-h1  threshold.config
[root@suricata suricata-3.1]# sudo vim suricata.yaml

 # Extensible Event Format (nicknamed EVE) event log in JSON format
  - eve-log:
      enabled: yes
      filetype: regular #regular|syslog|unix_dgram|unix_stream|redis
      filename: eve.json
      #prefix: "@cee: " # prefix to prepend to each log entry
      # the following are valid when type: syslog above
      #identity: "suricata"
      #facility: local5
      #level: Info ## possible levels: Emergency, Alert, Critical,
                   ## Error, Warning, Notice, Info, Debug
      #redis:
      #  server: 127.0.0.1
      #  port: 6379
      #  mode: list ## possible values: list (default), channel
      #  key: suricata ## key or channel to use (default to suricata)
      # Redis pipelining set up. This will enable to only do a query every
      # 'batch-size' events. This should lower the latency induced by network
      # connection at the cost of some memory. There is no flushing implemented
      # so this setting as to be reserved to high traffic suricata.
      #  pipelining:
      #    enabled: yes ## set enable to yes to enable query pipelining
      #    batch-size: 10 ## number of entry to keep in buffer
 types:
        - alert:
            # payload: yes             # enable dumping payload in Base64
            # payload-buffer-size: 4kb # max size of payload buffer to output in eve-log
            # payload-printable: yes   # enable dumping payload in printable (lossy) format
            # packet: yes              # enable dumping of packet (without stream segments)
            http: yes                # enable dumping of http fields
            tls: yes                 # enable dumping of tls fields
            ssh: yes                 # enable dumping of ssh fields
            smtp: yes                # enable dumping of smtp fields

            # HTTP X-Forwarded-For support by adding an extra field or overwriting
            # the source or destination IP address (depending on flow direction)
            # with the one reported in the X-Forwarded-For HTTP header. This is
            # helpful when reviewing alerts for traffic that is being reverse
            # or forward proxied.
            xff:
              enabled: no
              # Two operation modes are available, "extra-data" and "overwrite".
              mode: extra-data
              # Two proxy deployments are supported, "reverse" and "forward". In
              # a "reverse" deployment the IP address used is the last one, in a
              # "forward" deployment the first IP address is used.
              deployment: reverse
              # Header name where the actual IP address will be reported, if more
              # than one IP address is present, the last IP address will be the
              # one taken into consideration.
              header: X-Forwarded-For
 - http:
            extended: yes     # enable this for extended logging information
            # custom allows additional http fields to be included in eve-log
            # the example below adds three additional fields when uncommented
            #custom: [Accept-Encoding, Accept-Language, Authorization]
        - dns
        - tls:
            extended: yes     # enable this for extended logging information
        - files:
            force-magic: no   # force logging magic on all logged files
            force-md5: no     # force logging of md5 checksums
        #- drop:
        #    alerts: no       # log alerts that caused drops
 - smtp:
            #extended: yes # enable this for extended logging information
            # this includes: bcc, message-id, subject, x_mailer, user-agent
            # custom fields logging from the list:
            #  reply-to, bcc, message-id, subject, x-mailer, user-agent, received,
            #  x-originating-ip, in-reply-to, references, importance, priority,
            #  sensitivity, organization, content-md5, date
            #custom: [received, x-mailer, x-originating-ip, relays, reply-to, bcc]
            # output md5 of fields: body, subject
            # for the body you need to set app-layer.protocols.smtp.mime.body-md5
            # to yes
            #md5: [body, subject]

        - ssh
        - stats:
            totals: yes       # stats for all threads merged together
            threads: no       # per thread stats
            deltas: no        # include delta values
        # bi-directional flows
        - flow
        # uni-directional flows
        #- netflow
改为
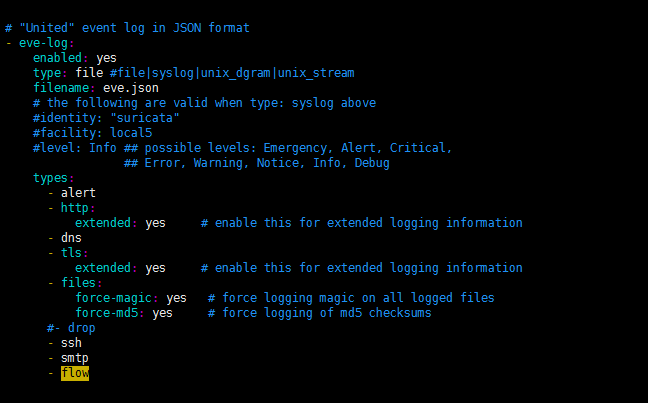
# "United" event log in JSON format
  - eve-log:
      enabled: yes
      type: file #file|syslog|unix_dgram|unix_stream
      filename: eve.json
      # the following are valid when type: syslog above
      #identity: "suricata"
      #facility: local5
      #level: Info ## possible levels: Emergency, Alert, Critical,
                   ## Error, Warning, Notice, Info, Debug
      types:
        - alert
        - http:
            extended: yes     # enable this for extended logging information
        - dns
        - tls:
            extended: yes     # enable this for extended logging information
        - files:
            force-magic: yes   # force logging magic on all logged files
            force-md5: yes     # force logging of md5 checksums
        #- drop
        - ssh
        - smtp
然后,接下是安装
Install ELK (elasticsearch, logstash, kibana)
先卸载自带的openjdk
rpm -qa|grep java
rpm -e --nodeps tzdata-java-2013g-1.el6.noarch
rpm -e --nodeps java-1.7.0-openjdk-1.7.0.45-2.4.3.3.el6.x86_64
rpm -e --nodeps java-1.6.0-openjdk-1.6.0.0-1.66.1.13.0.el6.x86_64
注意:这里一定要是jdk1.8,不然会报如下错误
[root@suricata ~]# sudo /etc/init.d/elasticsearch start
Starting elasticsearch: Elasticsearch requires at least Java 8 but your Java version from /usr/local/jdk/jdk1.7.0_79/bin/java does not meet this requirement
                                                           [FAILED]
[root@suricata ~]#
官网提示了,建议安装orcal 的 jdk。
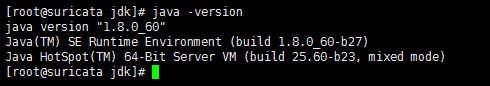
我这里安装jdk18。
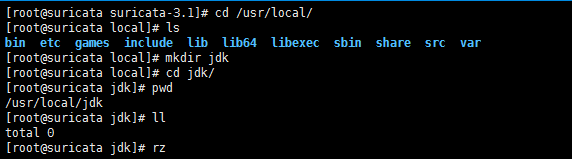
[root@suricata suricata-3.1]# cd /usr/local/
[root@suricata local]# ls
bin  etc  games  include  lib  lib64  libexec  sbin  share  src  var
[root@suricata local]# mkdir jdk
[root@suricata local]# cd jdk/
[root@suricata jdk]# pwd
/usr/local/jdk
[root@suricata jdk]# ll
total 0
[root@suricata jdk]# rz
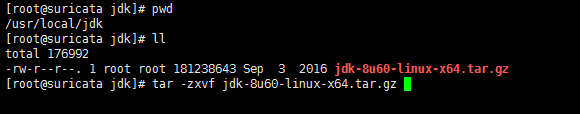
[root@suricata jdk]# pwd
/usr/local/jdk
[root@suricata jdk]# ll
total 176992
-rw-r--r--. 1 root root 181238643 Sep  3  2016 jdk-8u60-linux-x64.tar.gz
[root@suricata jdk]# tar -zxvf jdk-8u60-linux-x64.tar.gz
然后,再vim /etc/profile
#java
export JAVA_HOME=/usr/local/jdk/jdk1.8.0_60
export CLASSPATH=.:$JAVA_HOME/jre/lib/rt.jar:$JAVA_HOME/lib/dt.jar:$JAVA_HOME/lib/tools.jar
export PATH=$PATH:$JAVA_HOME/bin
文件生效
source /etc/profile
然后,接下来就是安装ELk和配置JDK。(注意以下只是个例子)
wget https://download.elasticsearch.org/kibana/kibana/kibana-3.0.0.tar.gz
wget https://download.elasticsearch.org/elasticsearch/elasticsearch/elasticsearch-1.6.1.deb
wget https://download.elastic.co/logstash/logstash/packages/debian/logstash_1.5.3-1_all.deb

tar -C /var/www/ -xzf kibana-3.0.0.tar.gz
dpkg -i elasticsearch-1.6.1.deb
dpkg -i logstash_1.5.3-1_all.deb
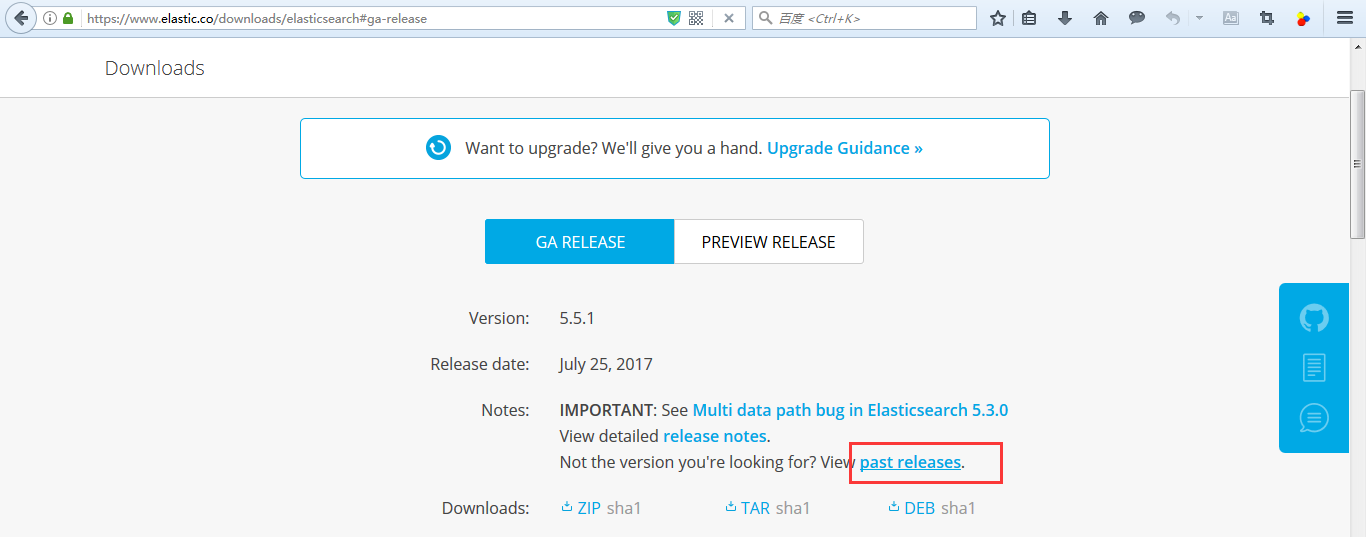
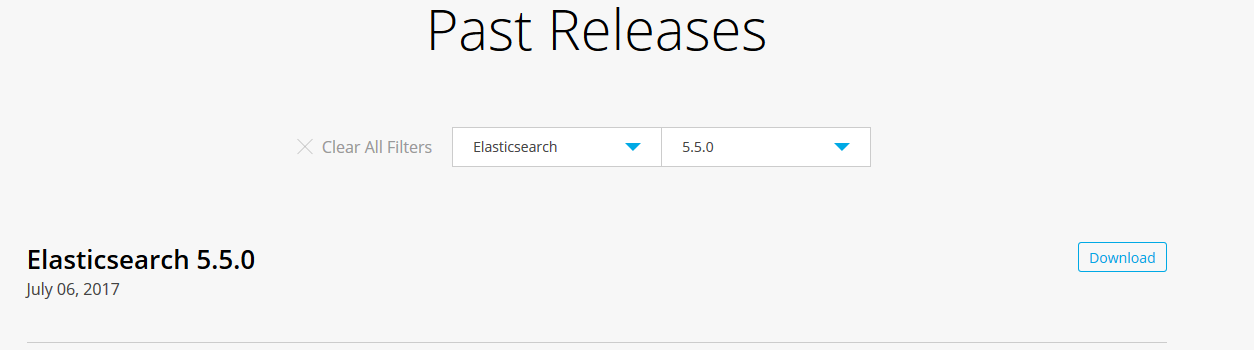
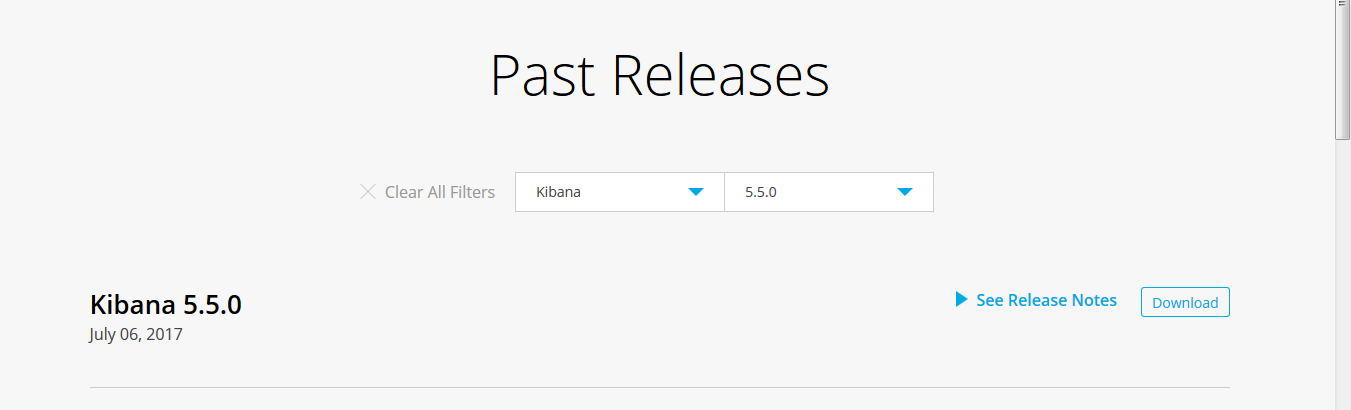
我这里啊,Elasticsearch选取5.5.0

所以,总的是
[root@suricata ~]# wget https://artifacts.elastic.co/downloads/elasticsearch/elasticsearch-5.5.0.deb
[root@suricata ~]# wget https://artifacts.elastic.co/downloads/logstash/logstash-5.5.0.deb
[root@suricata ~]# wget https://artifacts.elastic.co/downloads/kibana/kibana-5.5.0-linux-x86_64.tar.gz
最后下载,得到

[root@suricata ~]# pwd
/root
[root@suricata ~]# ls
anaconda-ks.cfg  Desktop    Downloads                install.log         kibana-5.5.0-linux-x86_64.tar.gz  Music     Public        suricata-3.1.tar.gz  Videos
data             Documents  elasticsearch-5.5.0.deb  install.log.syslog  logstash-5.5.0.deb                Pictures  suricata-3.1  Templates
[root@suricata ~]#
然后,进行对kibana的安装

[root@suricata ~]# pwd
/root
[root@suricata ~]# ls
anaconda-ks.cfg  Desktop    Downloads                install.log         kibana-5.5.0-linux-x86_64.tar.gz  Music     Public        suricata-3.1.tar.gz  Videos
data             Documents  elasticsearch-5.5.0.deb  install.log.syslog  logstash-5.5.0.deb                Pictures  suricata-3.1  Templates
[root@suricata ~]# tar -C /var/www/ -xzf kibana-5.5.0-linux-x86_64.tar.gz
得到
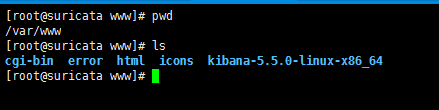
[root@suricata www]# pwd
/var/www
[root@suricata www]# ls
cgi-bin  error  html  icons  kibana-5.5.0-linux-x86_64
[root@suricata www]#
若大家没安装过这个命令,则安装下即可。
[root@suricata ~]# yum -y install dpkg
然后,进行对elasticsearch的安装

[root@suricata ~]# pwd
/root
[root@suricata ~]# ls
anaconda-ks.cfg  Desktop    Downloads                install.log         kibana-5.5.0-linux-x86_64.tar.gz  Music     Public        suricata-3.1.tar.gz  Videos
data             Documents  elasticsearch-5.5.0.deb  install.log.syslog  logstash-5.5.0.deb                Pictures  suricata-3.1  Templates
[root@suricata ~]# dpkg -i elasticsearch-5.5.0.deb
这里啊,我建议大家还是去安装tar.gz包,这种方式比较好。

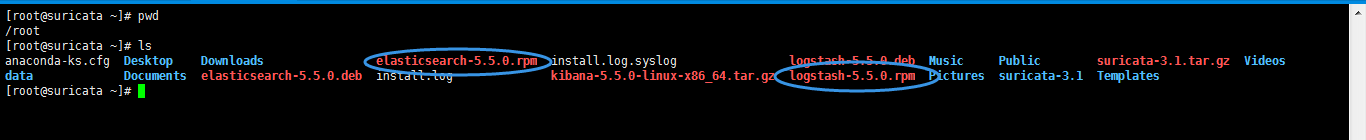
所以,后面,我还是下载了,rpm包,以这种方式来进行安装。
[root@suricata ~]# wget https://artifacts.elastic.co/downloads/elasticsearch/elasticsearch-5.5.0.rpm
[root@suricata ~]# wget https://artifacts.elastic.co/downloads/logstash/logstash-5.5.0.rpm
进行elasticsearch-5.5.0的安装

[root@suricata ~]# pwd
/root
[root@suricata ~]# ls
anaconda-ks.cfg  Desktop    Downloads                elasticsearch-5.5.0.rpm  install.log.syslog                logstash-5.5.0.deb  Music     Public        suricata-3.1.tar.gz  Videos
data             Documents  elasticsearch-5.5.0.deb  install.log              kibana-5.5.0-linux-x86_64.tar.gz  logstash-5.5.0.rpm  Pictures  suricata-3.1  Templates
[root@suricata ~]# rpm -ivh elasticsearch-5.5.0.rpm
warning: elasticsearch-5.5.0.rpm: Header V4 RSA/SHA512 Signature, key ID d88e42b4: NOKEY
Preparing... ########################################### [100%]
Creating elasticsearch group... OK
Creating elasticsearch user... OK
1:elasticsearch ########################################### [100%]
### NOT starting on installation, please execute the following statements to configure elasticsearch service to start automatically using chkconfig
sudo chkconfig --add elasticsearch
### You can start elasticsearch service by executing
sudo service elasticsearch start
安装完,默认即有

然后,进行logstash的安装

[root@suricata ~]# pwd
/root
[root@suricata ~]# ls
anaconda-ks.cfg  Desktop    Downloads                elasticsearch-5.5.0.rpm  install.log.syslog                logstash-5.5.0.deb  Music     Public        suricata-3.1.tar.gz  Videos
data             Documents  elasticsearch-5.5.0.deb  install.log              kibana-5.5.0-linux-x86_64.tar.gz  logstash-5.5.0.rpm  Pictures  suricata-3.1  Templates
[root@suricata ~]# rpm -ivh logstash-5.5.0.rpm
warning: logstash-5.5.0.rpm: Header V4 RSA/SHA512 Signature, key ID d88e42b4: NOKEY
Preparing...                ########################################### [100%]
   1:logstash               ########################################### [100%]
Using provided startup.options file: /etc/logstash/startup.options
/usr/share/logstash/vendor/jruby/bin/jruby: line 388: /usr/bin/java: No such file or directory
/usr/share/logstash/vendor/jruby/bin/jruby: line 388: exec: /usr/bin/java: cannot execute: No such file or directory
Unable to install system startup script for Logstash.
[root@suricata ~]#
安装完,默认即有
然后,下面是
Logstash configuration
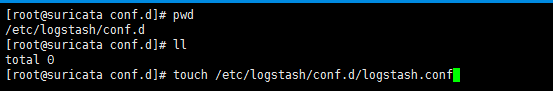
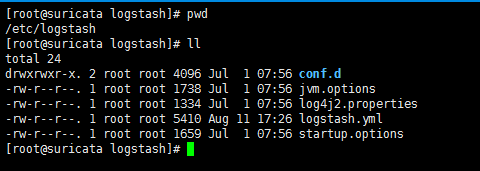
[root@suricata conf.d]# pwd
/etc/logstash/conf.d
[root@suricata conf.d]# ll
total 0
[root@suricata conf.d]# touch /etc/logstash/conf.d/logstash.conf
插入如下内容
input {
  file {
    path => ["/var/log/suricata/eve.json"]
    sincedb_path => ["/var/lib/logstash/"]
    codec =>   json
    type => "SuricataIDPS"
  }

}

filter {
  if [type] == "SuricataIDPS" {
    date {
      match => [ "timestamp", "ISO8601" ]
    }
    ruby {
      code => "if event['event_type'] == 'fileinfo'; event['fileinfo']['type']=event['fileinfo']['magic'].to_s.split(',')[0]; end;"
    }
  }

  if [src_ip]  {
    geoip {
      source => "src_ip"
      target => "geoip"
      #database => "/opt/logstash/vendor/geoip/GeoLiteCity.dat"
      add_field => [ "[geoip][coordinates]", "%{[geoip][longitude]}" ]
      add_field => [ "[geoip][coordinates]", "%{[geoip][latitude]}"  ]
    }
    mutate {
      convert => [ "[geoip][coordinates]", "float" ]
    }
    if ![geoip.ip] {
      if [dest_ip]  {
        geoip {
          source => "dest_ip"
          target => "geoip"
          #database => "/opt/logstash/vendor/geoip/GeoLiteCity.dat"
          add_field => [ "[geoip][coordinates]", "%{[geoip][longitude]}" ]
          add_field => [ "[geoip][coordinates]", "%{[geoip][latitude]}"  ]
        }
        mutate {
          convert => [ "[geoip][coordinates]", "float" ]
        }
      }
    }
  }
}

output {
  elasticsearch {
    host => localhost
    #protocol => http
  }
}
然后,再
Configure the start-up services
update-rc.d elasticsearch defaults 95 10 (这两个是ubuntu系统里的做法,我这里是centos系统,不需要)
update-rc.d logstash defaults
service httpd start                    启动apache
service elasticsearch start
service logstash start
或者

启动服务sudo /etc/init.d/elasticsearch start
停止服务sudo /etc/init.d/elasticsearch stop
启动服务sudo /etc/init.d/logstash/start
停止服务sudo /etc/init.d/logstashstop
如果大家在启动过程中,出现如下问题。
[root@suricata ~]# sudo /etc/init.d/elasticsearch start
which: no java in (/sbin:/usr/sbin:/bin:/usr/bin)
Could not find any executable java binary. Please install java in your PATH or set JAVA_HOME
[root@suricata ~]#
则见
ElasticSearch里JAVA环境丢失的问题
-rwxr-x---. 1 root root 5113 Jul 1 07:20 elasticsearch ,经过
[root@suricata init.d]# chmod 755  elasticsearch
[root@suricata init.d]# pwd
/etc/init.d
[root@suricata init.d]#
改为
-rwxr-xr-x. 1 root root 5113 Jul 1 07:20 elasticsearch
大家,自行按照自己的jdk位置。
export JAVA_HOME=/usr/local/jdk/jdk1.8.0_60
然后,就可以成功了。

[root@suricata ~]# sudo /etc/init.d/elasticsearch start
Starting elasticsearch:                                    [  OK  ]
[root@suricata ~]#
然后,大家也许在启动,会遇到这样的问题:
Logstash默认的配置文件位置为./config和/etc/logstash/,后者已经存在,但直接运行依然会报错:
WARNING: Could not find logstash.yml which is typically located in $LS_HOME/config or /etc/logstash.
见
Logstash使用grok解析IIS日志
简单起见,直接在Logstash根目录创建软链接即可:
cd /usr/share/logstash
[root@suricata logstash]# pwd
/usr/share/logstash
[root@suricata logstash]# ln -s /etc/logstash ./config
[root@suricata logstash]#
设置配置文件实时生效,从而不用频繁地启停Logstash。
修改/etc/logstash/logstash.yml
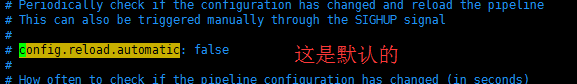
config.reload.automatic: true
Logstash的运行
与Elasticsearch、Kibana不同,Logstash默认并不作为系统服务安装,我们也不建议作为服务启动。主要原因为:大多数情况下,Elasticsearch、Kibana在每台服务器上只有一个实例,可以作为服务启动;而一个Logstash实例一般只服务于一个数据流,因此一台服务器上经常运行多个实例 。编写一个配置文件helloworld.conf进行测试。注意,不要把该文件放在/etc/logstash/conf.d下,以避免不同实例间产生混淆,因为该文件夹是Logstash默认读取的文件夹。简单起见,可直接放在Logstash根目录下。
input {
    stdin {}
}
output {
    stdout {}
}
这是一个命令行输入、命令行输出的Logstash实例,运行成功则说明已配置正确:
bin/logstash -f helloworld.conf
虽然如此,很多时候我们还是希望各个Logstash实例能随系统而启动并在后台运行。将其加入计划任务即可:
nohup /usr/share/logstash/bin/logstash -f /usr/share/logstash/helloworld.conf > /dev/null &
然后,
Now make sure Suricata is running and you have logs written in your JSON log files
http://localhost/kibana-5.5.0
https://redmine.openinfosecfoundation.org/projects/suricata/wiki/_Logstash_Kibana_and_Suricata_JSON_output
继续