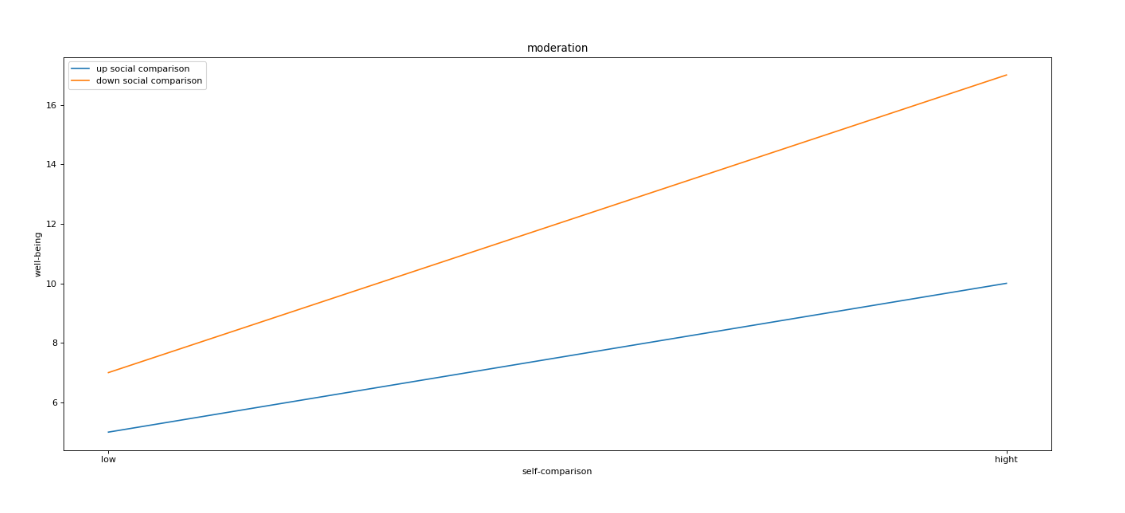
from matplotlib import pyplot as plt
x = [0,1]
y = [5,10]
x_2 = [0,1]
y_2 = [7,17]

x_ticks = ["low","hight"]
plt.figure(figsize=(20,8),dpi=80)
plt.xticks(x,x_ticks)
plt.plot(x,y,label = "up social comparison")
plt.plot(x_2,y_2,label = "down social comparison")
plt.xlabel("self-comparison")
plt.ylabel("well-being")
plt.legend()
plt.title("moderation")
#plt.grid()
plt.savefig("./figure.png")
plt.show()