原题,以不剪枝的决策树作为基学习器,对西瓜数据集实现Adaboost分类。
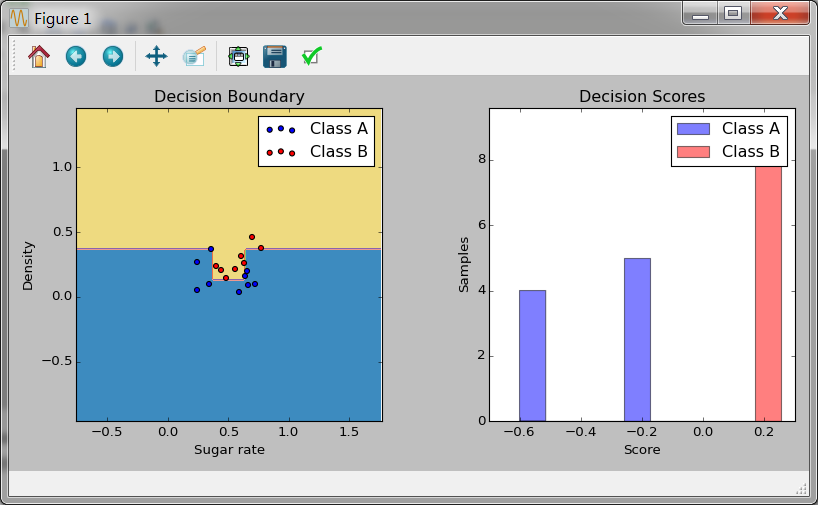
#!/usr/bin/python
# -*- coding:utf-8 -*-
import numpy as np
import matplotlib.pyplot as plt

from sklearn.ensemble import AdaBoostClassifier
from sklearn.tree import DecisionTreeClassifier

file1 = open('c:quantwatermelon.csv','r')
data = [line.strip('
').split(',') for line in file1]
data = np.array(data)
#X = [[float(raw[-7]),float(raw[-6]),float(raw[-5]),float(raw[-4]),float(raw[-3]), float(raw[-2])] for raw in data[1:,1:-1]]

X = [[float(raw[-3]), float(raw[-2])] for raw in data[1:]]
y = [1 if raw[-1]=='1' else 0 for raw in data[1:]]
X = np.array(X)
y = np.array(y)


# Create and fit an AdaBoosted decision tree,不剪枝决策树
bdt = AdaBoostClassifier(DecisionTreeClassifier(),
                         algorithm="SAMME",
                         n_estimators=200)

bdt.fit(X, y)

plot_colors = "br"
plot_step = 0.02
class_names = "AB"

plt.figure(figsize=(10, 5))

# Plot the decision boundaries
plt.subplot(121)
x_min, x_max = X[:, 0].min() - 1, X[:, 0].max() + 1
y_min, y_max = X[:, 1].min() - 1, X[:, 1].max() + 1
xx, yy = np.meshgrid(np.arange(x_min, x_max, plot_step),
                     np.arange(y_min, y_max, plot_step))

Z = bdt.predict(np.c_[xx.ravel(), yy.ravel()])
Z = Z.reshape(xx.shape)
cs = plt.contourf(xx, yy, Z, cmap=plt.cm.Paired)
plt.axis("tight")

# Plot the training points
for i, n, c in zip(range(2), class_names, plot_colors):
    idx = np.where(y == i)
    plt.scatter(X[idx, 0], X[idx, 1],
                c=c, cmap=plt.cm.Paired,
                label="Class %s" % n)
plt.xlim(x_min, x_max)
plt.ylim(y_min, y_max)
plt.legend(loc='upper right')
plt.xlabel('Sugar rate')
plt.ylabel('Density')
plt.title('Decision Boundary')

# Plot the two-class decision scores
twoclass_output = bdt.decision_function(X)
plot_range = (twoclass_output.min(), twoclass_output.max())
plt.subplot(122)
for i, n, c in zip(range(2), class_names, plot_colors):
    plt.hist(twoclass_output[y == i],
             bins=10,
             range=plot_range,
             facecolor=c,
             label='Class %s' % n,
             alpha=.5)
x1, x2, y1, y2 = plt.axis()
plt.axis((x1, x2, y1, y2 * 1.2))
plt.legend(loc='upper right')
plt.ylabel('Samples')
plt.xlabel('Score')
plt.title('Decision Scores')

plt.tight_layout()
plt.subplots_adjust(wspace=0.35)
plt.show()
运行结果如下:
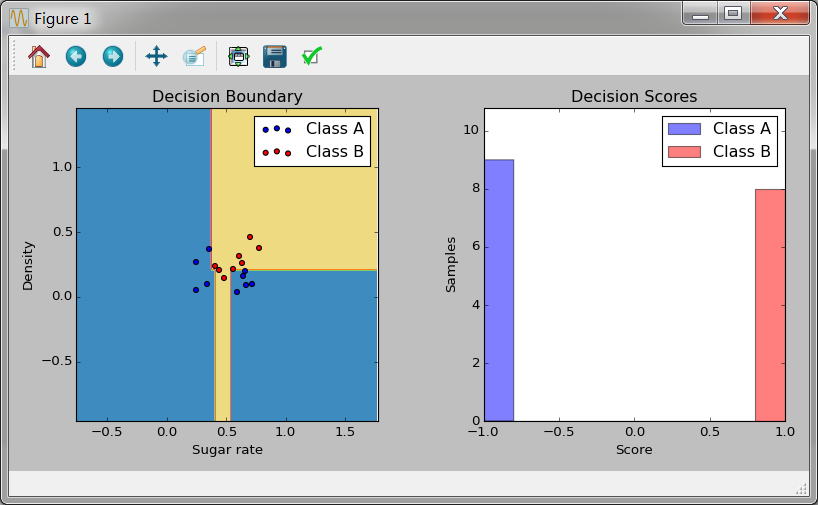
分类结果训练结果相当好。当然也测试了最大深度为1的决策树作为基学习器,结果如下: