原题是分别采用线性核和高斯核对西瓜数据集进行SVM的训练,周老师推荐的是LIMSVM,这里我使用的仍然是sklearn。
#!/usr/bin/python
# -*- coding:utf-8 -*-
import numpy as np
import matplotlib.pyplot as plt
from sklearn import svm, datasets

file1 = open('c:quantwatermelon.csv','r')
data = [line.strip('
').split(',') for line in file1]
data = np.array(data)
X = [[float(raw[-2]), float(raw[-1])] for raw in data[1:,1:-1]]
#X = [[float(raw[-3]), float(raw[-2])] for raw in data[1:]]
y = [1 if raw[-1]=='1' else 0 for raw in data[1:]]
X = np.array(X)
y = np.array(y)

h = .02  # step size in the mesh

# we create an instance of SVM and fit out data. We do not scale our
# data since we want to plot the support vectors
C = 1000  # SVM regularization parameter
svc = svm.SVC(kernel='linear', C=C).fit(X, y)
rbf_svc = svm.SVC(kernel='rbf', gamma=0.7, C=C).fit(X, y)


# create a mesh to plot in
x_min, x_max = X[:, 0].min() - 1, X[:, 0].max() + 1
y_min, y_max = X[:, 1].min() - 1, X[:, 1].max() + 1
xx, yy = np.meshgrid(np.arange(x_min, x_max, h),
                     np.arange(y_min, y_max, h))

# title for the plots
titles = ['SVC with linear kernel',
          'SVC with RBF kernel']


for i, clf in enumerate((svc, rbf_svc)):
    # Plot the decision boundary. For that, we will assign a color to each
    # point in the mesh [x_min, m_max]x[y_min, y_max].
    plt.subplot(1, 2, i + 1)
    plt.subplots_adjust(wspace=0.4, hspace=0.4)

    Z = clf.predict(np.c_[xx.ravel(), yy.ravel()])

    # Put the result into a color plot
    Z = Z.reshape(xx.shape)
    plt.contourf(xx, yy, Z, cmap=plt.cm.Paired, alpha=0.8)

    # Plot also the training points
    plt.scatter(X[:, 0], X[:, 1], c=y, cmap=plt.cm.Paired)
    plt.xlabel('Sugar content')
    plt.ylabel('Density')
    plt.xlim(xx.min(), xx.max())
    plt.ylim(yy.min(), yy.max())
    plt.xticks(())
    plt.yticks(())
    plt.title(titles[i])

plt.show()
结果如下:
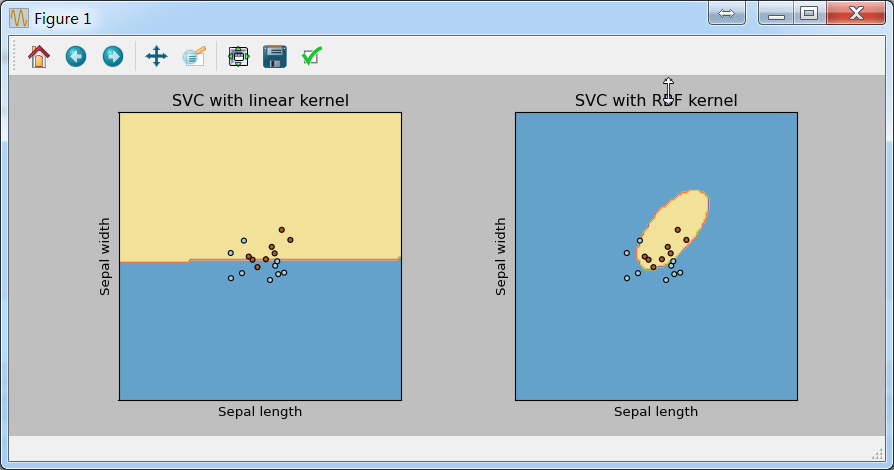
线性核的支持向量也是线性的,高斯核的支持向量是曲线。