转载自zabbix
常用Zabbix监控项说明,主要包括常见Windows & Linux监控,如下:
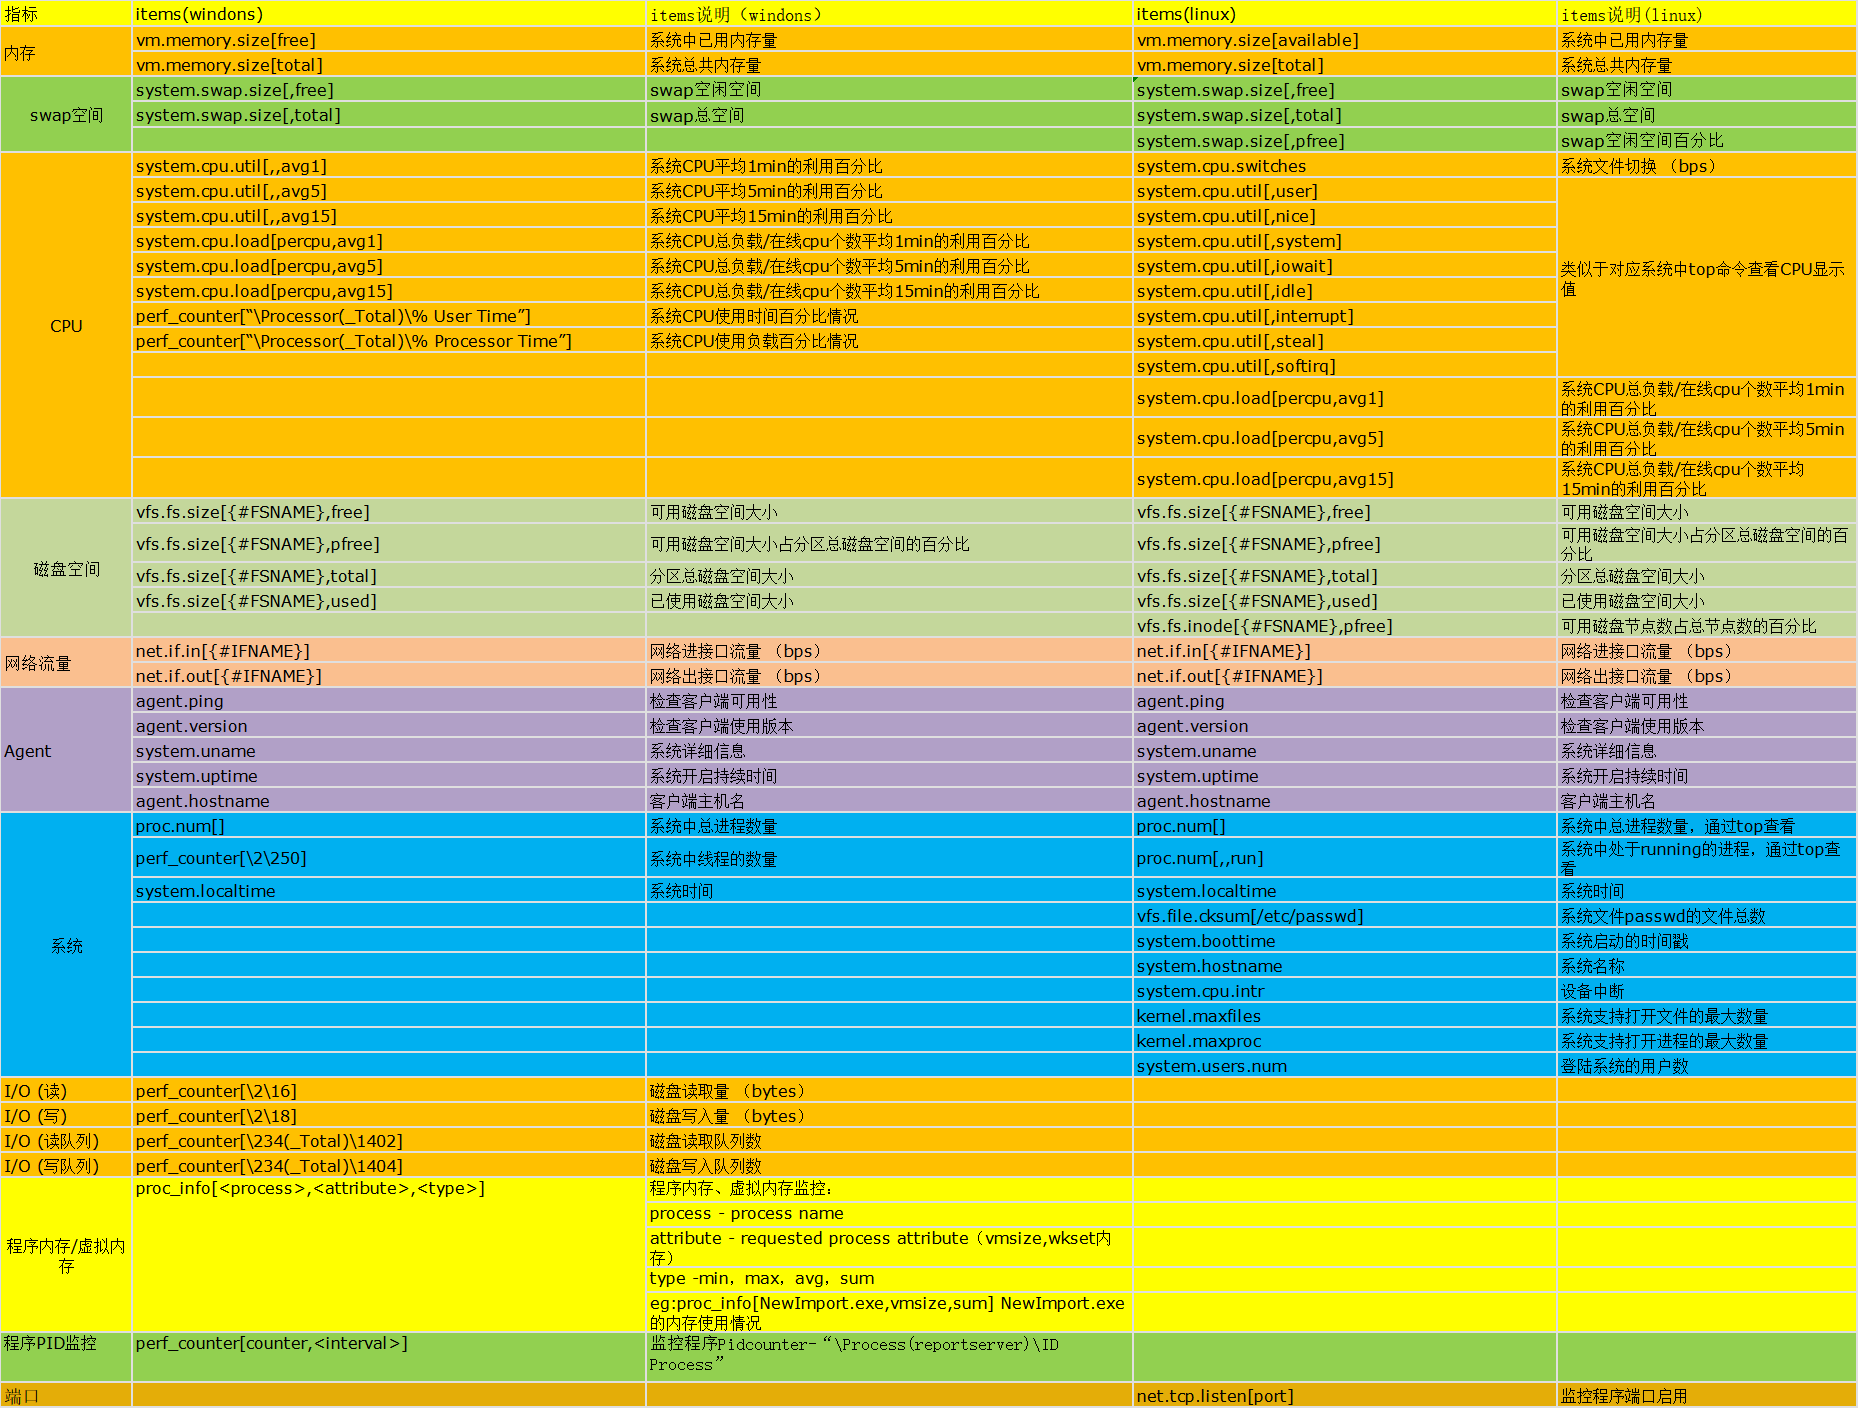

指标	      items(windons)	                             items说明(windons)	   items(linux)         	      items说明(linux)
内存	      vm.memory.size[free]	                      系统中已用内存量	          vm.memory.size[available]	      系统中已用内存量
	      vm.memory.size[total]	                        系统总共内存量	            vm.memory.size[total]	      系统总共内存量
swap空间      system.swap.size[,free]	                        swap空闲空间	            system.swap.size[,free]  	      swap空闲空间
	      system.swap.size[,total]	                        swap总空间	             system.swap.size[,total]	         swap总空间
	      system.swap.size[,pfree]	                       swap空闲空间百分比
CPU	      system.cpu.util[,,avg1]	                       系统CPU平均1min的利用百分比	system.cpu.switches	      系统文件切换 (bps)
	      system.cpu.util[,,avg5]	                        系统CPU平均5min的利用百分比	system.cpu.util[,user]	      类似于对应系统中top命令查看CPU显示值
	      system.cpu.util[,,avg15]	                        系统CPU平均15min的利用百分比	system.cpu.util[,nice]
	     system.cpu.load[percpu,avg1]	系统CPU总负载/在线cpu个数平均1min的利用百分比	system.cpu.util[,system]
	      system.cpu.load[percpu,avg5]	系统CPU总负载/在线cpu个数平均5min的利用百分比	system.cpu.util[,iowait]
	       system.cpu.load[percpu,avg15]	系统CPU总负载/在线cpu个数平均15min的利用百分比	system.cpu.util[,idle]
	       perf_counter[“Processor(_Total)\% User Time”]	系统CPU使用时间百分比情况	system.cpu.util[,interrupt]
	        perf_counter[“Processor(_Total)\% Processor Time”]	系统CPU使用负载百分比情况	system.cpu.util[,steal]
			system.cpu.util[,softirq]
			system.cpu.load[percpu,avg1]	系统CPU总负载/在线cpu个数平均1min的利用百分比
			system.cpu.load[percpu,avg5]	系统CPU总负载/在线cpu个数平均5min的利用百分比
			system.cpu.load[percpu,avg15]	系统CPU总负载/在线cpu个数平均15min的利用百分比
磁盘空间	      vfs.fs.size[{#FSNAME},free]	可用磁盘空间大小	vfs.fs.size[{#FSNAME},free]	可用磁盘空间大小
	      vfs.fs.size[{#FSNAME},pfree]	可用磁盘空间大小占分区总磁盘空间的百分比	vfs.fs.size[{#FSNAME},pfree]	可用磁盘空间大小占分区总磁盘空间的百分比
	      vfs.fs.size[{#FSNAME},total]	分区总磁盘空间大小	vfs.fs.size[{#FSNAME},total]	分区总磁盘空间大小
	      vfs.fs.size[{#FSNAME},used]	已使用磁盘空间大小	vfs.fs.size[{#FSNAME},used]	已使用磁盘空间大小
			vfs.fs.inode[{#FSNAME},pfree]	可用磁盘节点数占总节点数的百分比
网络流量      	net.if.in[{#IFNAME}]	网络进接口流量 (bps)	net.if.in[{#IFNAME}]	网络进接口流量 (bps)
	      net.if.out[{#IFNAME}]	网络出接口流量 (bps)	net.if.out[{#IFNAME}]	网络出接口流量 (bps)
Agent      	agent.ping	检查客户端可用性	agent.ping	检查客户端可用性
	      agent.version	检查客户端使用版本	agent.version	检查客户端使用版本
	      system.uname	系统详细信息	system.uname	系统详细信息
	      system.uptime	系统开启持续时间	system.uptime	系统开启持续时间
	      agent.hostname	客户端主机名	agent.hostname	客户端主机名
系统	      proc.num[]	系统中总进程数量	proc.num[]	系统中总进程数量,通过top查看
	      perf_counter[2250]	系统中线程的数量	proc.num[,,run]	系统中处于running的进程,通过top查看
	      system.localtime	系统时间	system.localtime	系统时间
			                                    vfs.file.cksum[/etc/passwd]	系统文件passwd的文件总数
			                                    system.boottime	系统启动的时间戳
			                                    system.hostname	系统名称
			                                    system.cpu.intr	设备中断
			                                    kernel.maxfiles	系统支持打开文件的最大数量
			                                    kernel.maxproc	系统支持打开进程的最大数量
			                                    system.users.num	登陆系统的用户数
I/O (读)	perf_counter[216]	磁盘读取量 (bytes)
I/O (写)	perf_counter[218]	磁盘写入量 (bytes)
I/O (读队列)	perf_counter[234(_Total)1402]	磁盘读取队列数
I/O (写队列)	perf_counter[234(_Total)1404]	磁盘写入队列数
程序内存/虚拟内存	                        proc_info[<process>,<attribute>,<type>]	程序内存、虚拟内存监控:
		process - process name
		attribute - requested process attribute(vmsize,wkset内存)
		type -min,max,avg,sum
		eg:proc_info[NewImport.exe,vmsize,sum] NewImport.exe的内存使用情况
程序PID监控	perf_counter[counter,<interval>]	监控程序Pidcounter-“Process(reportserver)ID Process”

端口			net.tcp.listen[port]	监控程序端口启用