xAxis 属性
xAxis : [
{
	type : 'category',//坐标轴类型
	// show:'',//是否显示 x 轴
	//id:'',组件 ID。默认不指定。
	//gridIndex :'',x 轴所在的 grid 的索引,默认位于第一个 grid
	ogridIndex :'',//ffset:'',//X 轴相对于默认位置的偏移,在相同的 position 上有多个 X 轴的时候有用
	position:'bottom',//x 轴的位置
	data : ['Mon', 'Tue', 'Wed', 'Thu', 'Fri', 'Sat', 'Sun'],
	name:'中国',//坐标轴名称
	nameLocation:'middle',//坐标轴名称显示位置
	nameTextStyle:{
	//坐标轴名称的文字样式
	color:'yellow',//坐标轴名称的颜色
	fontStyle:'oblique',//坐标轴名称文字字体的风格
	fontWeight:'bold',//坐标轴名称文字字体的粗细
	fontFamily:'Arial',//坐标轴名称文字的字体系列
	fontSize:'16',//坐标轴名称文字的字体大小
	align:'center',//文字水平对齐方式
	textVerticalAlign:'bottom',//文字垂直对齐方式
	lineHeight:'20',//行高
	backgroundColor:'#9999',//文字块背景色
	borderColor:'blue',//文字块边框颜色
	borderWidth:'20',//文字块边框宽度
	barBorderRadius:'',//文字块的圆角
	shadowColor:'green',//文字块的背景阴影颜色
	shadowBlur:'19',//文字块的背景阴影长度
	shadowOffsetX:'5',//文字块的背景阴影 X 偏移
	shadowOffsetY:'15',//文字块的背景阴影 Y 偏移
	'50',//文字块的宽度
	height:'70',//文字块的高度
	textareaBorderColor:'white',//文字本身的描边颜色
	textShadowColor:'#7777',//文字本身的阴影颜色
	textShadowBlur:'#1111',//文字本身的阴影长度
	textShadowOffsetX:'20',//文字本身的阴影 X 偏移
	textShadowOffsetY:'25',//文字本身的阴影 Y 偏移
	label:{
	/* rich:{//自定义富文本样式
	a: {
	color: 'red',
	lineHeight: 10
	}
	}*/
	}
},
	nameGap :'20',//坐标轴名称与轴线之间的距离
	nameRotate:'20',//坐标轴名字旋转,角度值
	inverse :'false',//是否是反向坐标轴
	boundaryGap: ['20%', '20%'],//坐标轴两边留白策略
	min :'12',//坐标轴刻度最小值
	max :'12',//坐标轴刻度最大值
	scale :'false',//只在数值轴中(type: 'value')有效
	splitNumber:'3',//坐标轴的分割段数
	minInterval :'12',//自动计算的坐标轴最小间隔大小
	maxInterval:'12',//自动计算的坐标轴最大间隔大小
	interval :'',//强制设置坐标轴分割间隔
	logBase :'',//对数轴的底数
	silent :'',//坐标轴的标签是否响应和触发鼠标事件,默认不响应
	axisLine :{
		//坐标轴轴线相关设置
		show:' ',//是否显示坐标轴轴线
		onZero:' ',//X 轴或者 Y 轴的轴线是否在另一个轴的 0 刻度
		onZeroAxisIndex:'12',//当有双轴时,可以用这个属性手动指定,在哪个轴的 0 刻度上
		symbol:'arrow',//轴线两边的箭头
		symbolSize:[19, 15] ,//轴线两边的箭头的大小,第一个数字表示宽度(垂直坐标轴方向),第二个数字表示高度(平行坐标轴方向)
		symbolOffset:[12,23],//轴线两边的箭头的偏移
		lineStyle:{
		color:"#555",//坐标轴线线的颜色
		'2',//坐标轴线线宽
		type:'dashed',//坐标轴线线的类型
		shadowBlur:'12',//图形阴影的模糊大小
		shadowColor:'red',//阴影颜色
		shadowOffsetX:'12',//阴影水平方向上的偏移距离
		shadowOffsetY:'6',//阴影垂直方向上的偏移距离
		opacity:'6'//图形透明度

		}
	},
	axisTick :{
		//坐标轴刻度相关设置
		show:'teue',//是否显示坐标轴刻度
		alignWithLabel:'ture',//保证刻度线和标签对齐
		interval:'',//坐标轴刻度的显示间隔
		//inside:'false',//坐标轴刻度是否朝内,默认朝外
		length:'7',//坐标轴刻度的长度
		lineStyle:{
		color:'red',// 刻度线的颜色
		'2',//坐标轴刻度线宽
		type:'solid',//坐标轴刻度线的类型
		shadowBlur:'2',//图形阴影的模糊大小
		shadowColor:'blue',//阴影颜色
		shadowOffsetX:'1',//阴影水平方向上的偏移距离
		shadowOffsetY:'1',//阴影垂直方向上的偏移距离
		opacity:'2',//图形透明度
		}
	} ,
axisLabel :{
	//坐标轴刻度标签的相关设置
	show:'true ',//是否显示刻度标签
	interval:'auto',//坐标轴刻度标签的显示间隔,在类目轴中有效
	// inside:'false ',//刻度标签是否朝内,默认朝外
	rotate:'23',//刻度标签旋转的角度
	margin:'19',//刻度标签与轴线之间的距离
	///formatter刻度标签的内容格式器
	showMinLabel:'null',//是否显示最小 tick 的 label
	showMaxLabel:'null',//是否显示最大 tick 的 label
	color:'red',//刻度标签文字的颜色
	fontStyle:'italic',//文字字体的风格
	fontWeight:'bold',//文字字体的粗细
	fontFamily:'Microsoft YaHei',//文字的字体系列
	fontSize:'14',//文字的字体大小
	align:'center',//文字水平对齐方式
	verticalAlign:'center',//文字垂直对齐方式
	lineHeight:'23',//行高
	backgroundColor:'#9999',//文字块背景色
	borderColor:'#fff',//文字块边框颜色
	borderWidth:'12',//文字块边框宽度
	borderRadius:'21',//文字块的圆角
	padding:[3, 4, 5, 6],//文字块的内边距
	shadowColor:'blue',//文字块的背景阴影颜色
	shadowBlur:'5',//文字块的背景阴影长度
	shadowOffsetX:'3',//文字块的背景阴影 X 偏移
	shadowOffsetY:'3',//文字块的背景阴影 Y 偏移
	'12',//文字块的宽度
	height:'12',//文字块的高度。一般不用指定,不指定则自动是文字的高度

	},


	}
],
legend属性:
 //控制 legend 的位置和样式
    legend:[{
		    	bottom: 1,
		    	left: "40%",
	            textStyle:{color: 'red'},
	            data:['2011年'],
	        },

	        {
		    	bottom: 1,
		    	left: "60%",
	            textStyle:{color: 'blue'},
	            data:['2012年'],
	        }, {
		    	bottom: 1,
		    	left: "80%",
	            textStyle:{color: 'blue'},
	            data:['2013年'],
	        },
	        ],

grid属性:
//直角坐标系内绘图网格样式和位置
 grid: {
        left: '3%',
        right: '4%',
        bottom: '7%',
        show :'true',
       backgroundColor :'#9999',
       containLabel: true
    },
title属性:
//标题组件,包含主标题和副标题
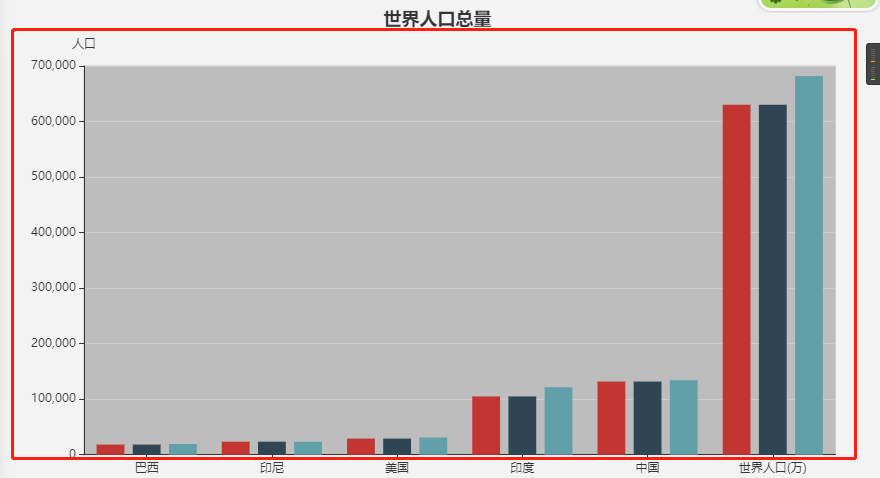
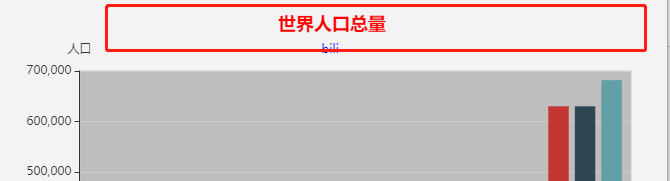
title: {
text: '世界人口总量',
subtext :'bili ',
left :'center',
textStyle:{
color:'red'
},
subtextStyle :{
color:'blue'
}
},
tooltip属性
 //提示框组件。
    tooltip: {
        trigger: 'item',
        axisPointer: {
            type: 'line',
            lineStyle:{
              ''  ,
              type:'dashed'
            }
        },
        textStyle:{
            color:'red'
        }
    },

toolbox属性
//工具栏。内置有导出图片,数据视图,动态类型切换,数据区域缩放,重置五个工具。
toolbox: {
        feature: {
            dataView: {show: true, readOnly: false},
            magicType: {show: true, type: ['line', 'bar']},
            restore: {show: true},
            saveAsImage: {show: true}
        }
    },
series属性
 series: [
        {
      //折线
            name: '2011年',
            type: 'line',
            symbol :'triangle',
            symbolRotate:'12',
            symbolSize :'6',
            showSymbol :'false',
            itemStyle :{
                //折线拐点标志的样式
                borderColor:'blue',
           borderWidth:'3'
            },
            lineStyle :{
                //线条样式。
                '5',
                type :'dashed'
            },
            areaStyle :{
                //区域填充样式
                color:'yellow',

            },
            emphasis :{
               //图形的高亮样式。
               itemStyle:{
                   color:'white'
               }
            },
            smooth :'true',
            data: [13203, 53489, 21034, 104970, 131744, 830230]
        },{
            name: '2013年',
            type: 'bar',
            data: [65203, 23489, 29034, 10970, 131744, 330230]
        },
        {
            name: '2012年',
            type: 'bar',
            data: [19325, 238838, 31000, 121594, 134141, 081807]
        }
    ]
