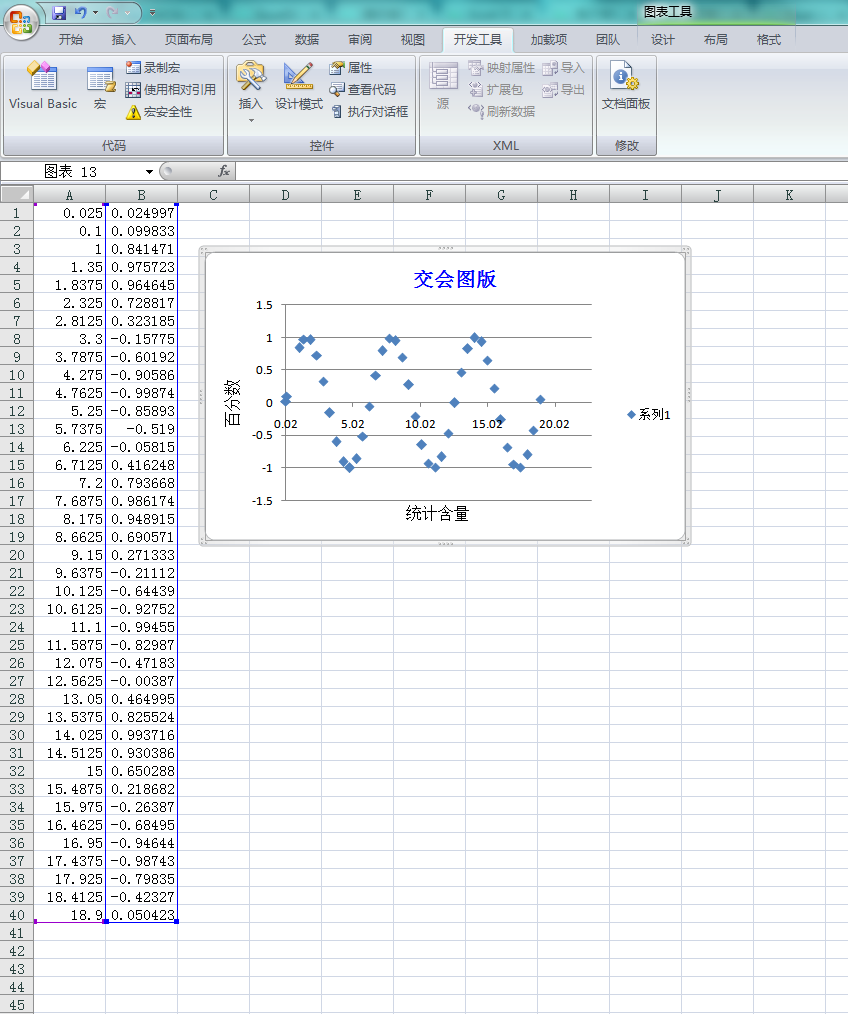
 1 '--------------------------------------------------------Module1--------------------------------------------------------
 2 Sub Macro1()
 3     ActiveSheet.Range("B1:B40").Select
 4     ActiveSheet.Shapes.AddChart.Select
 5     ActiveChart.ChartType = xlXYScatter
 6     ActiveChart.SetSourceData Source:=Range("'Sheet1'!$A$1:$B$40")
 7     With ActiveChart
 8         .HasTitle = True                                    '为图表设置标题
 9         With .ChartTitle
10             .Text = "交会图版"
11             .Font.Name = "宋体"
12             .Font.Size = 15
13             .Font.ColorIndex = 5
14             .Top = 5
15             .Left = 150
16         End With
17         With .Axes(xlCategory)                             '为图表设置横坐标
18             .HasTitle = True
19             .AxisTitle.Text = "统计含量"
20             .AxisTitle.Font.Name = "宋体"
21             .AxisTitle.Font.Size = 12
22             .AxisTitle.Font.Bold = False
23             .AxisTitle.Font.ColorIndex = 1
24             .MinimumScale = Cells(1, 1) - Cells(1, 1) * 0.2
25             .MaximumScale = Cells(40, 1) + Cells(40, 1) * 0.2
26         End With
27
28         With .Axes(xlValue)                               '为图表设置纵坐标
29             .HasTitle = True
30             .AxisTitle.Text = "百分数"
31             .AxisTitle.Font.Name = "宋体"
32             .AxisTitle.Font.Size = 12
33             .AxisTitle.Font.Bold = False
34             .AxisTitle.Font.ColorIndex = 1
35             ' i = Excel.Application.WorksheetFunction.Match("203", f, 0)
36             .MinimumScale = Excel.Application.WorksheetFunction.Min(Range("B:B")) '**zbl**范围要加一个Range才不会出错,下面的不行
37             .MaximumScale = Excel.Application.WorksheetFunction.Max(Range("B:B"))
38 '            .MinimumScale = Excel.Application.WorksheetFunction.Min("B:B")
39 '            .MaximumScale = Excel.Application.WorksheetFunction.Max("B:B")
40 '            .MinimumScale = Application.WorksheetFunction.Min("b1:b40")
41 '            .MaximumScale = Application.WorksheetFunction.Max("b4:b40")
42 'Sub UseFunction()
43 '    Dim myRange As Range
44 '    Set myRange = Worksheets("Sheet1").Range("A1:C10")
45 '    answer = Application.WorksheetFunction.Max搜索(myRange)
46 '    MsgBox answer
47 'End Sub
48         End With
49         .HasLegend = True                                      '为图表设置图例
50         With .Legend
51             .Position = xlLegendPositionRight
52             .Font.ColorIndex = 5
53             .Font.Bold = True
54         End With
55     End With
56
57 End Sub
多个系列:

参考:http://club.excelhome.net/thread-1199400-1-1.html
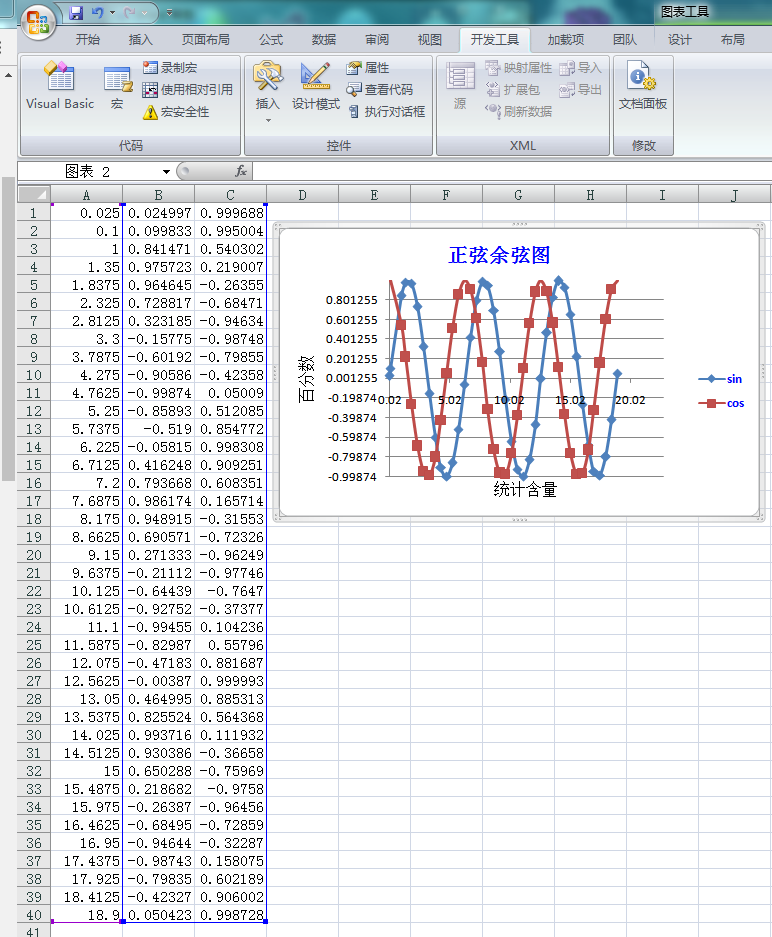
 1 '--------------------------------------------------------Module1--------------------------------------------------------
 2 Sub Macro1()
 3     ActiveSheet.Range("B1:C40").Select
 4     ActiveSheet.Shapes.AddChart.Select
 5     ActiveChart.ChartType = xlXYScatterSmooth '平滑线散点图
 6     ActiveChart.SetSourceData Source:=Range("'Sheet1'!$A$1:$C$40")
 7     With ActiveChart
 8         .HasTitle = True                                    '为图表设置标题
 9         .SeriesCollection(1).Name = "sin"                   '为图例设置名称
10         .SeriesCollection(2).Name = "cos"                   '.SeriesCollection(i).Name=Worksheets("Sheet1").Range("A" & i)
11         With .ChartTitle
12             .Text = "正弦余弦图"
13             .Font.Name = "宋体"
14             .Font.Size = 15
15             .Font.ColorIndex = 5
16             .Top = 5
17             .Left = 120
18         End With
19         With .Axes(xlCategory)                             '为图表设置横坐标
20             .HasTitle = True
21             .AxisTitle.Text = "统计含量"
22             .AxisTitle.Font.Name = "宋体"
23             .AxisTitle.Font.Size = 12
24             .AxisTitle.Font.Bold = False
25             .AxisTitle.Font.ColorIndex = 1
26             .MinimumScale = Cells(1, 1) - Cells(1, 1) * 0.2
27             .MaximumScale = Cells(40, 1) + Cells(40, 1) * 0.2
28         End With
29
30         With .Axes(xlValue)                               '为图表设置纵坐标
31             .HasTitle = True
32             .AxisTitle.Text = "百分数"
33             .AxisTitle.Font.Name = "宋体"
34             .AxisTitle.Font.Size = 12
35             .AxisTitle.Font.Bold = False
36             .AxisTitle.Font.ColorIndex = 1
37             ' i = Excel.Application.WorksheetFunction.Match("203", f, 0)
38             .MinimumScale = Excel.Application.WorksheetFunction.Min(Range("B:B")) '**zbl**范围要加一个Range才不会出错,下面的不行
39             .MaximumScale = Excel.Application.WorksheetFunction.Max(Range("B:B"))
40 '            .MinimumScale = Excel.Application.WorksheetFunction.Min("B:B")
41 '            .MaximumScale = Excel.Application.WorksheetFunction.Max("B:B")
42 '            .MinimumScale = Application.WorksheetFunction.Min("b1:b40")
43 '            .MaximumScale = Application.WorksheetFunction.Max("b4:b40")
44 'Sub UseFunction()
45 '    Dim myRange As Range
46 '    Set myRange = Worksheets("Sheet1").Range("A1:C10")
47 '    answer = Application.WorksheetFunction.Max搜索(myRange)
48 '    MsgBox answer
49 'End Sub
50         End With
51         .HasLegend = True                                      '为图表设置图例
52         With .Legend
53             .Position = xlLegendPositionRight
54             .Font.ColorIndex = 5
55             .Font.Bold = True
56         End With
57
58     End With
59
60 End Sub
设置网格线:

 1 '--------------------------------------------------------Module1--------------------------------------------------------
 2 Sub Macro1()
 3     ActiveSheet.Range("B1:C40").Select
 4     ActiveSheet.Shapes.AddChart.Select
 5     ActiveChart.ChartType = xlXYScatterSmooth '平滑线散点图
 6     ActiveChart.SetSourceData Source:=Range("'Sheet1'!$A$1:$C$40")
 7     ActiveWindow.GridlineColor = RGB(255, 0, 0) '窗体excel网格周围的线成红色了
 8     ActiveWindow.DisplayGridlines = False
 9     With ActiveChart
10         .HasTitle = True                                    '为图表设置标题
11         .SeriesCollection(1).Name = "sin"                   '为图例设置名称
12         .SeriesCollection(2).Name = "cos"                   '.SeriesCollection(i).Name=Worksheets("Sheet1").Range("A" & i)
13         With .ChartTitle
14             .Text = "正弦余弦图"
15             .Font.Name = "宋体"
16             .Font.Size = 15
17             .Font.ColorIndex = 5
18             .Top = 5
19             .Left = 120
20         End With
21         With .Axes(xlCategory)                             '为图表设置横坐标
22             .HasTitle = True
23             .AxisTitle.Text = "统计含量"
24             .AxisTitle.Font.Name = "宋体"
25             .AxisTitle.Font.Size = 12
26             .AxisTitle.Font.Bold = False
27             .AxisTitle.Font.ColorIndex = 1
28             .MinimumScale = Cells(1, 1) - Cells(1, 1) * 0.2
29             .MaximumScale = Cells(40, 1) + Cells(40, 1) * 0.2
30         End With
31
32         With .Axes(xlValue)                               '为图表设置纵坐标
33             .HasTitle = True
34             .AxisTitle.Text = "百分数"
35             .AxisTitle.Font.Name = "宋体"
36             .AxisTitle.Font.Size = 12
37             .AxisTitle.Font.Bold = False
38             .AxisTitle.Font.ColorIndex = 1
39             ' i = Excel.Application.WorksheetFunction.Match("203", f, 0)
40             .MinimumScale = Excel.Application.WorksheetFunction.Min(Range("B:B")) '**zbl**范围要加一个Range才不会出错,下面的不行
41             .MaximumScale = Excel.Application.WorksheetFunction.Max(Range("B:B"))
42 '            .MinimumScale = Excel.Application.WorksheetFunction.Min("B:B")
43 '            .MaximumScale = Excel.Application.WorksheetFunction.Max("B:B")
44 '            .MinimumScale = Application.WorksheetFunction.Min("b1:b40")
45 '            .MaximumScale = Application.WorksheetFunction.Max("b4:b40")
46 'Sub UseFunction()
47 '    Dim myRange As Range
48 '    Set myRange = Worksheets("Sheet1").Range("A1:C10")
49 '    answer = Application.WorksheetFunction.Max搜索(myRange)
50 '    MsgBox answer
51 'End Sub
52         End With
53         .HasLegend = True                                      '为图表设置图例
54         With .Legend
55             .Position = xlLegendPositionRight
56             .Font.ColorIndex = 5
57             .Font.Bold = True
58         End With
59         Range("c1:d2").Borders.LineStyle = xlContinuous '区域全部设置线
60         Range("c1:d2").Borders.LineStyle = xlNone          '取消单元格线’
61         Range("d4").Borders(xlEdgeTop).LineStyle = xlContinuous '只设置单元格d3顶线 http://www.excelpx.com/thread-294531-1-1.html
62
63
64         With Range("a1:b2").Borders
65             .LineStyle = xlContinuous   '设置边框线
66             .Weight = xlThick           '设置边框线为粗线
67         End With
68
69     End With
70
71 End Sub
说明
每个 ChartObject 对象都代表一个嵌入图表。ChartObject 对象充当 Chart 对象的容器。ChartObject 对象的属性和方法控制工作表上嵌入图表的外观和大小。ChartObjects 集合
示例
使用 ChartObjects 方法返回 ChartObjects 集合。以下示例删除名为“Sheet1”的工作表上的所有嵌入图表。
| Visual Basic for Applications |
|---|
|
不能使用 ChartObjects 集合来调用以下属性和方法:
- RoundedCorners 属性
- Locked 属性
- Placement 属性
- PrintObject 属性
- Shadow属性
- SendToBack 方法
- BringToFront 方法
与早期版本不同,ChartObjects 集合现在可以读取有关高度、宽度、左对齐和顶对齐的属性。
使用 Add 方法可创建一个新的空嵌入图表并将它添加到集合中。使用 ChartWizard 方法可添加数据并设置新图表的格式。以下示例创建一个新嵌入图表,然后以折线图形式添加单元格 A1:A20 中的数据。
| Visual Basic for Applications |
|---|
|
使用 ChartObjects(index)(其中 index 是嵌入图表的索引号或名称)可以返回单个对象。以下示例设置名为“Sheet1”的工作表上嵌入图表 Chart 1 中的图表区图案。
| Visual Basic for Applications |
|---|
|
1 Dim ch As ChartObject
2 Set ch = Worksheets("sheet1").ChartObjects.Add(100, 30, 400, 250)
3 ch.Chart.ChartWizard source:=Worksheets("sheet1").Range("a1:a20"), _
4     gallery:=xlLine, title:="New Chart"