Matplotlib是python中绘图的库
plot:其中最重要的一个函数,允许绘制2D图
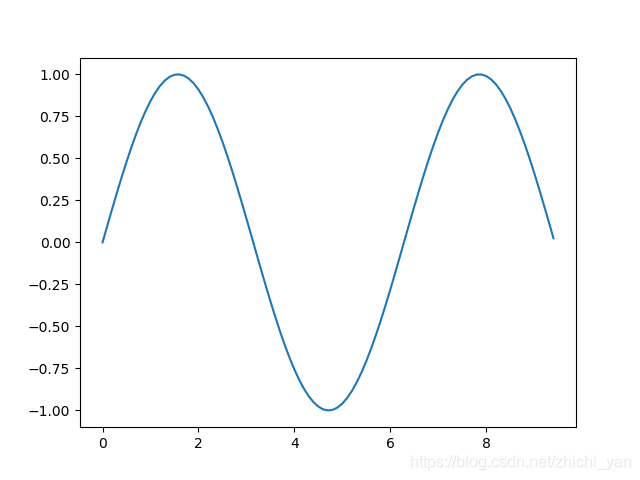
单图单线
>>> import numpy as np        //将numpy库以简化的np导入,引用时用np代表
>>> import matplotlib.pyplot as plt  //同理导入 matplotlib.pyplot
>>> x = np.arange(0, 3 * np.pi, 0.1) //x为从0到3π中间隔为0.1的点
>>> y=np.sin(x) //y=sin(x)
>>> plt.plot(x,y)  //给x,y绘点
[<matplotlib.lines.Line2D object at 0x0000000015F76518>]
>>> plt.show() //显示绘制的图
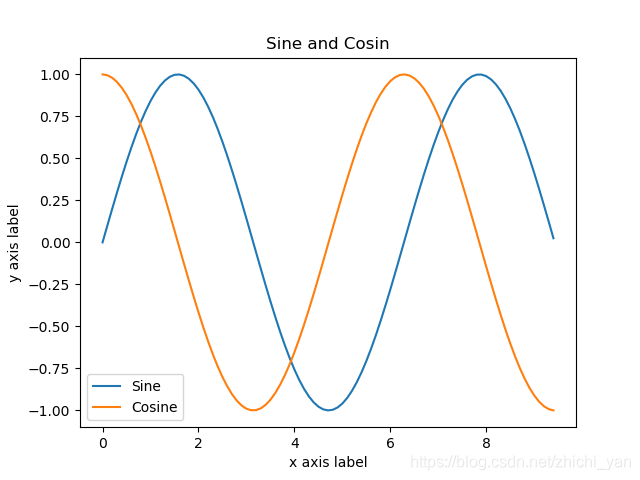
单图多线
>>> y_sin=np.sin(x)  //y_sin=sin(x)
>>> y_cos=np.cos(x) //y_cos=cos(x)
>>> plt.plot(x,y_sin) //绘图
[<matplotlib.lines.Line2D object at 0x00000000128B7A58>]
>>> plt.plot(x,y_cos)//绘图
[<matplotlib.lines.Line2D object at 0x00000000129CB438>]
//给x、y轴贴标签
>>> plt.xlabel('x axis label')
Text(0.5, 0, 'x axis label')
>>> plt.ylabel('y axis label')
Text(0, 0.5, 'y axis label')
>>> plt.title('Sine and Cosin')
Text(0.5, 1.0, 'Sine and Cosin') //贴标题
>>> plt.legend(['Sine','Cosine']) //贴铭文
<matplotlib.legend.Legend object at 0x00000000128B7E80>
>>> plt.show()
Subplot函数
通过subplot函数,可以实现在同一张图片中绘制上下或者左右2个子图
>>> plt.subplot(2, 1, 1) //2行一列图格,激活第一个方格
<matplotlib.axes._subplots.AxesSubplot object at 0x00000000128C5C18>
>>> plt.plot(x, y_sin) //绘图
[<matplotlib.lines.Line2D object at 0x00000000128C53C8>]
>>> plt.title('Sine') //置标题
Text(0.5, 1.0, 'Sine')
>>> plt.subplot(2, 1, 2)
<matplotlib.axes._subplots.AxesSubplot object at 0x00000000128333C8>
>>> plt.plot(x, y_cos)
[<matplotlib.lines.Line2D object at 0x000000001282BF60>]
>>> plt.title('Cosine')
Text(0.5, 1.0, 'Cosine') //同上
>>> plt.show() //显示
