1 import numpy as np
2
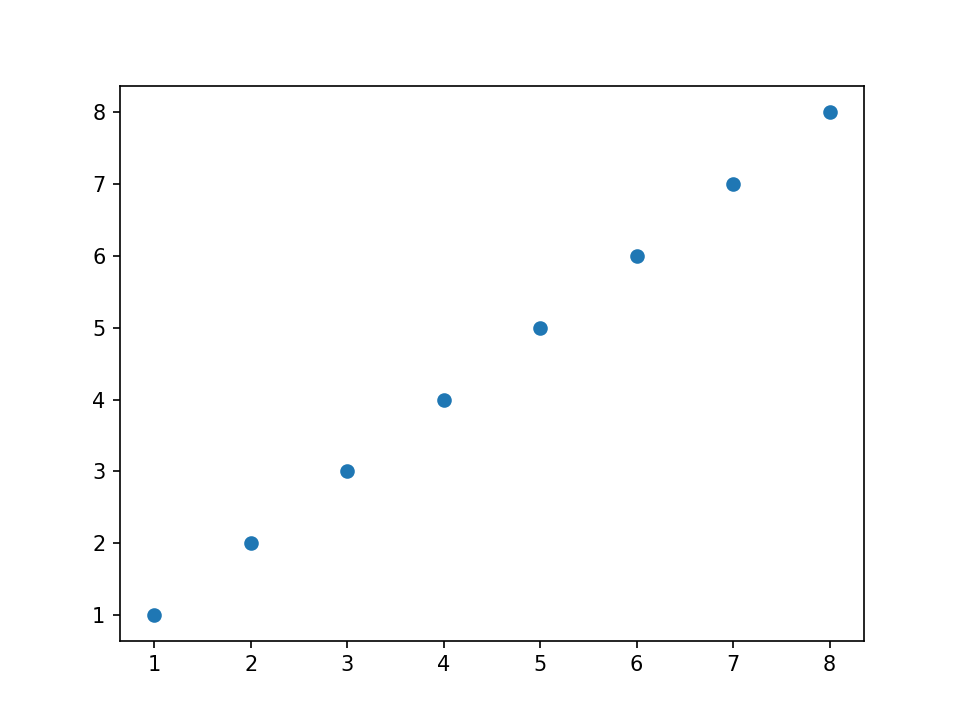
3 x = np.array([1,2,3,4,5,6,7,8])
4 y = x
5
6 plt.figure()
7 plt.scatter(x, y) # similar to plt.plot(x, y, '.'), but the underlying child objects in the axes are not Line2D
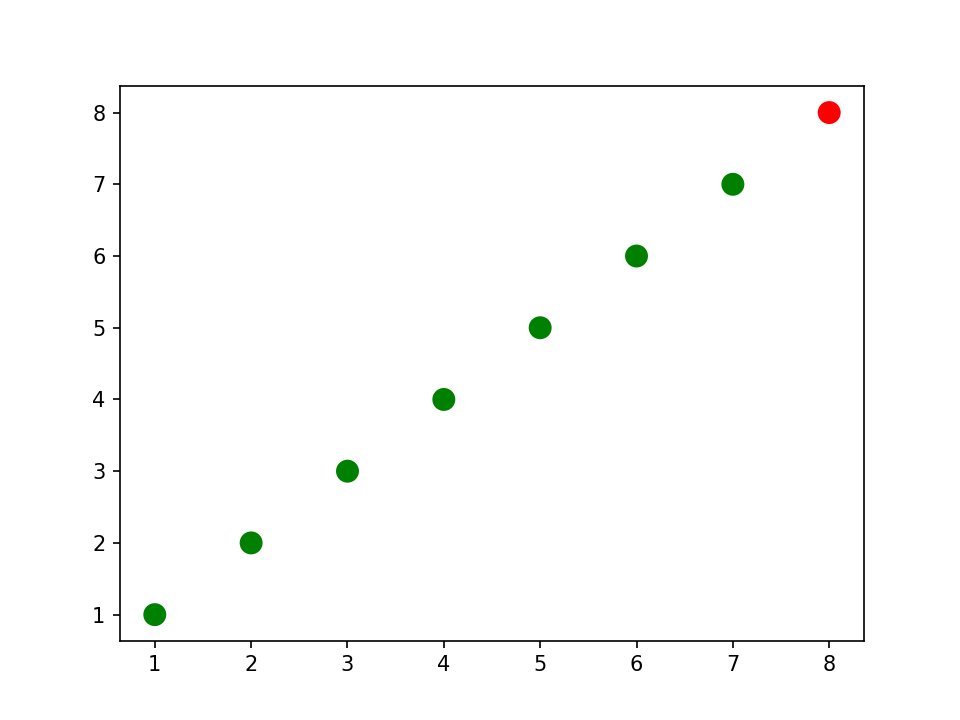
使用colors数组来决定画点的颜色
size来决定画点的大小
 1 import numpy as np
 2
 3 x = np.array([1,2,3,4,5,6,7,8])
 4 y = x
 5
 6 # create a list of colors for each point to have
 7 # ['green', 'green', 'green', 'green', 'green', 'green', 'green', 'red']
 8 colors = ['green']*(len(x)-1)
 9 colors.append('red')
10
11 plt.figure()
12
13 # plot the point with size 100 and chosen colors
14 plt.scatter(x, y, s=100, c=colors)
zip()把每次从每个参数中提取一个元素组成一个元组
把两个链表合并成一个元组列表
 1 # convert the two lists into a list of pairwise tuples
 2 zip_generator = zip([1,2,3,4,5], [6,7,8,9,10])
 3
 4 print(list(zip_generator))
 5 # the above prints:
 6 # [(1, 6), (2, 7), (3, 8), (4, 9), (5, 10)]
 7
 8 zip_generator = zip([1,2,3,4,5], [6,7,8,9,10])
 9 # *为对zip进行解包
10 print(*zip_generator)
11 # the above prints:
12 # (1, 6) (2, 7) (3, 8) (4, 9) (5, 10)
[(1, 6), (2, 7), (3, 8), (4, 9), (5, 10)]
(1, 6) (2, 7) (3, 8) (4, 9) (5, 10)
 1 # use zip to convert 5 tuples with 2 elements each to 2 tuples with 5 elements each
 2 print(list(zip((1, 6), (2, 7), (3, 8), (4, 9), (5, 10))))
 3 # the above prints:
 4 # [(1, 2, 3, 4, 5), (6, 7, 8, 9, 10)]
 5
 6
 7 zip_generator = zip([1,2,3,4,5], [6,7,8,9,10])
 8 # let's turn the data back into 2 lists
 9 x, y = zip(*zip_generator) # This is like calling zip((1, 6), (2, 7), (3, 8), (4, 9), (5, 10))
10 print(x)
11 print(y)
12 # the above prints:
13 # (1, 2, 3, 4, 5)
14 # (6, 7, 8, 9, 10)
[(1, 2, 3, 4, 5), (6, 7, 8, 9, 10)]
(1, 2, 3, 4, 5)
(6, 7, 8, 9, 10)
label为表格添加标题
1 plt.figure()
2 # plot a data series 'Tall students' in red using the first two elements of x and y
3 plt.scatter(x[:2], y[:2], s=100, c='red', label='Tall students')
4 # plot a second data series 'Short students' in blue using the last three elements of x and y
5 plt.scatter(x[2:], y[2:], s=100, c='blue', label='Short students')
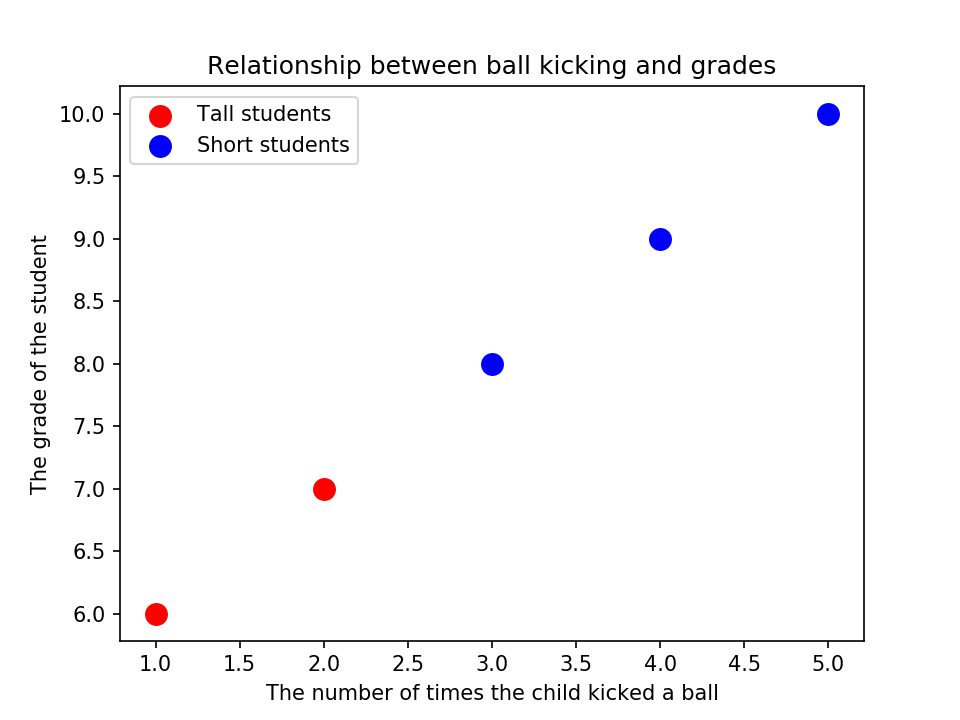
为上图添加横纵坐标的标注
1 # add a label to the x axis
2 plt.xlabel('The number of times the child kicked a ball')
3 # add a label to the y axis
4 plt.ylabel('The grade of the student')
5 # add a title
6 plt.title('Relationship between ball kicking and grades')
如上图左上角,对点的类型添加标注
1 # add a legend (uses the labels from plt.scatter)
2 plt.legend()
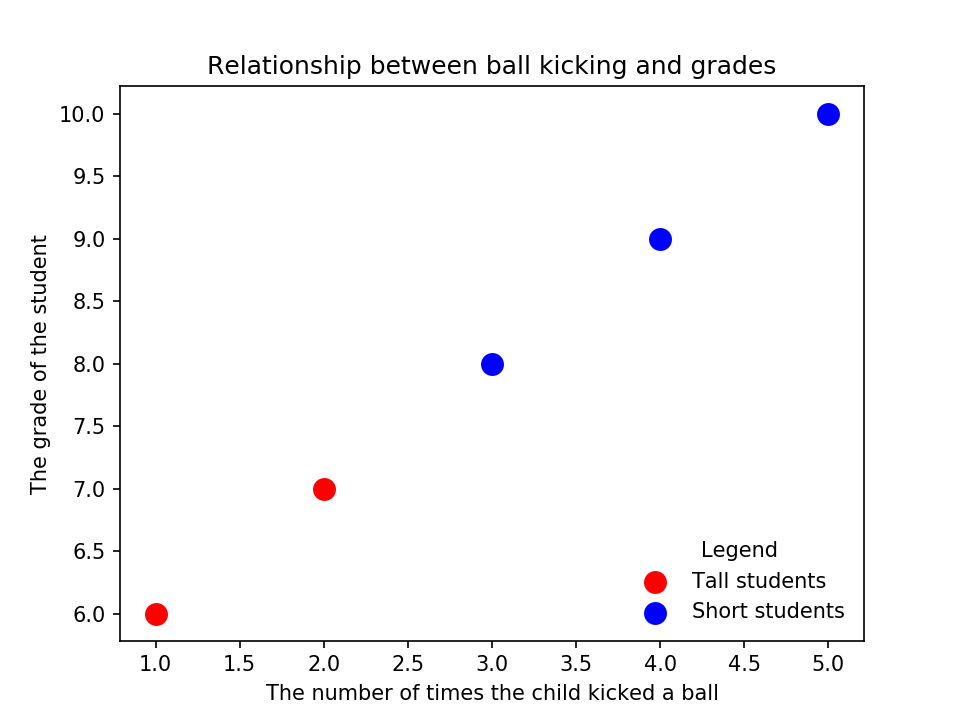
在图的右下角添加点类型的标注
1 # add the legend to loc=4 (the lower right hand corner), also gets rid of the frame and adds a title
2 plt.legend(loc=4, frameon=False, title='Legend')
得到当前坐标的子元素
1 # get children from current axes (the legend is the second to last item in this list)
2 plt.gca().get_children()
[<matplotlib.collections.PathCollection at 0x7f24b0085ac8>,
 <matplotlib.collections.PathCollection at 0x7f24b008c5c0>,
 <matplotlib.spines.Spine at 0x7f24bf8e59b0>,
 <matplotlib.spines.Spine at 0x7f24bfa41d68>,
 <matplotlib.spines.Spine at 0x7f24bf8e3eb8>,
 <matplotlib.spines.Spine at 0x7f24c820ba58>,
 <matplotlib.axis.XAxis at 0x7f24bf968128>,
 <matplotlib.axis.YAxis at 0x7f24b00cc470>,
 <matplotlib.text.Text at 0x7f24b00e7128>,
 <matplotlib.text.Text at 0x7f24b00e7198>,
 <matplotlib.text.Text at 0x7f24b00e7208>,
 <matplotlib.legend.Legend at 0x7f24b004f780>,
 <matplotlib.patches.Rectangle at 0x7f24b00e7240>]
从当前坐标中得到legend
1 # get the legend from the current axes
2 legend = plt.gca().get_children()[-2]
1 # you can use get_children to navigate through the child artists
2 legend.get_children()[0].get_children()[1].get_children()[0].get_children()
[<matplotlib.offsetbox.HPacker at 0x7f24b0055518>,
 <matplotlib.offsetbox.HPacker at 0x7f24b0055588>]
不是很懂有什么用= =,
 1 # import the artist class from matplotlib
 2 from matplotlib.artist import Artist
 3
 4 def rec_gc(art, depth=0):
 5     if isinstance(art, Artist):
 6         # increase the depth for pretty printing
 7         print("  " * depth + str(art))
 8         for child in art.get_children():
 9             rec_gc(child, depth+2)
10
11 # Call this function on the legend artist to see what the legend is made up of
12 rec_gc(plt.legend())
Legend
    <matplotlib.offsetbox.VPacker object at 0x7f24b009f748>
        <matplotlib.offsetbox.TextArea object at 0x7f24b009f9b0>
            Text(0,0,'None')
        <matplotlib.offsetbox.HPacker object at 0x7f24b00a9390>
            <matplotlib.offsetbox.VPacker object at 0x7f24b00a9710>
                <matplotlib.offsetbox.HPacker object at 0x7f24b009ff28>
                    <matplotlib.offsetbox.DrawingArea object at 0x7f24b00a9c50>
                        <matplotlib.collections.PathCollection object at 0x7f24b00a94a8>
                    <matplotlib.offsetbox.TextArea object at 0x7f24b00a97f0>
                        Text(0,0,'Tall students')
                <matplotlib.offsetbox.HPacker object at 0x7f24b009ff60>
                    <matplotlib.offsetbox.DrawingArea object at 0x7f24b00a44e0>
                        <matplotlib.collections.PathCollection object at 0x7f24b00a4320>
                    <matplotlib.offsetbox.TextArea object at 0x7f24b00a9518>
                        Text(0,0,'Short students')
    FancyBboxPatch(0,0;1x1)