转自: http://aredko.blogspot.com/2014/02/knowing-how-all-your-components-work.html
In today's post we will try to cover very interesting and important topic: distributed system tracing. What it practically means is that we will try to trace the request from the point it was issued by the client to the point the response to this request was received. At first, it looks quite straightforward but in reality it may involve many calls to several other systems, databases, NoSQL stores, caches, you name it ...
In 2010 Google published a paper about Dapper, a large-scale distributed systems tracing infrastructure (very interesting reading by the way). Later on, Twitter built its own implementation based on Dapper paper, called Zipkin and that's the one we are going to look at.
We will build a simple JAX-RS 2.0 server using great Apache CXF library. For the client side, we will use JAX-RS 2.0 client API and by utilizing Zipkin we will trace all the interactions between the client and the server (as well as everything happening on server side). To make an example a bit more illustrative, we will pretend that server uses some kind of database to retrieve the data. Our code will be a mix of pure Java and a bit of Scala (the choice of Scala will be cleared up soon).
One additional dependency in order for Zipkin to work is Apache Zookeeper. It is required for coordination and should be started in advance. Luckily, it is very easy to do:
Now back to Zipkin. Zipkin is written in Scala. It is still in active development and the best way to start off with it is just by cloning its GitHub repository and build it from sources:
git clone https://github.com/twitter/zipkin.git
From architectural prospective, Zipkin consists of three main components:
- collector: collects traces across the system
- query: queries collected traces
- web: provides web-based UI to show the traces
To run them, Zipkin guys provide useful scripts in the bin folder with the only requirement that JDK 1.7 should be installed:
- bin/collector
- bin/query
- bin/web
Let's execute these scripts and ensure that every component has been started successfully, with no stack traces on the console (for curious readers, I was not able to make Zipkin work on Windows so I assume we are running it on Linux box). By default,Zipkin web UI is available on port 8080. The storage for traces is embedded SQLite engine. Though it works, the better storages (like awesome Redis) are available.
The preparation is over, let's do some code. We will start with JAX-RS 2.0 client part as it's very straightforward (ClientStarter.java):
01 |
package com.example.client; |
03 |
import javax.ws.rs.client.Client; |
04 |
import javax.ws.rs.client.ClientBuilder; |
05 |
import javax.ws.rs.core.MediaType; |
06 |
import javax.ws.rs.core.Response; |
08 |
import com.example.zipkin.Zipkin; |
09 |
import com.example.zipkin.client.ZipkinRequestFilter; |
10 |
import com.example.zipkin.client.ZipkinResponseFilter; |
12 |
public class ClientStarter { |
13 |
public static void main( final String[] args ) throws Exception { |
14 |
final Client client = ClientBuilder |
16 |
.register( new ZipkinRequestFilter( "People", Zipkin.tracer() ), 1 ) |
17 |
.register( new ZipkinResponseFilter( "People", Zipkin.tracer() ), 1 ); |
19 |
final Response response = client |
21 |
.request( MediaType.APPLICATION_JSON ) |
24 |
if( response.getStatus() == 200 ) { |
25 |
System.out.println( response.readEntity( String.class ) ); |
Except a couple of imports and classes with Zipkin in it, everything should look simple. So what those ZipkinRequestFilter andZipkinResponseFilter are for? Zipkin is awesome but it's not a magical tool. In order to trace any request in distributed system, there should be some context passed along with it. In REST/HTTP world, it's usually request/response headers. Let's take a look on ZipkinRequestFilter first (ZipkinRequestFilter.scala):
01 |
package com.example.zipkin.client |
03 |
import javax.ws.rs.client.ClientRequestFilter |
04 |
import javax.ws.rs.ext.Provider |
05 |
import javax.ws.rs.client.ClientRequestContext |
06 |
import com.twitter.finagle.http.HttpTracing |
07 |
import com.twitter.finagle.tracing.Trace |
08 |
import com.twitter.finagle.tracing.Annotation |
09 |
import com.twitter.finagle.tracing.TraceId |
10 |
import com.twitter.finagle.tracing.Tracer |
13 |
class ZipkinRequestFilter( val name: String, val tracer: Tracer ) extendsClientRequestFilter { |
14 |
def filter( requestContext: ClientRequestContext ): Unit = { |
15 |
Trace.pushTracerAndSetNextId( tracer, true ) |
17 |
requestContext.getHeaders().add( HttpTracing.Header.TraceId, Trace.id.traceId.toString ) |
18 |
requestContext.getHeaders().add( HttpTracing.Header.SpanId, Trace.id.spanId.toString ) |
20 |
Trace.id._parentId foreach { id => |
21 |
requestContext.getHeaders().add( HttpTracing.Header.ParentSpanId, id.toString ) |
24 |
Trace.id.sampled foreach { sampled => |
25 |
requestContext.getHeaders().add( HttpTracing.Header.Sampled, sampled.toString ) |
28 |
requestContext.getHeaders().add( HttpTracing.Header.Flags, Trace.id.flags.toLong.toString ) |
30 |
if( Trace.isActivelyTracing ) { |
31 |
Trace.recordRpcname( name, requestContext.getMethod() ) |
32 |
Trace.recordBinary( "http.uri", requestContext.getUri().toString() ) |
33 |
Trace.record( Annotation.ClientSend() ) |
A bit of Zipkin internals will make this code superclear. The central part of Zipkin API is Trace class. Every time we would like to initiate tracing, we should have a Trace Id and the tracer to actually trace it. This single line generates new Trace Id and register the tracer (internally this data is held in thread local state).
1 |
Trace.pushTracerAndSetNextId( tracer, true ) |
Traces are hierarchical by nature, so do Trace Ids: every Trace Id could be a root or part of another trace. In our example, we know for sure that we are the first and as such the root of the trace. Later on the Trace Id is wrapped into HTTP headers and will be passed along the request (we will see on server side how it is being used). The last three lines associate the useful information with the trace: name of our API (People), HTTP method, URI and most importantly, that it's the client sending the request to the server.
1 |
Trace.recordRpcname( name, requestContext.getMethod() ) |
2 |
Trace.recordBinary( "http.uri", requestContext.getUri().toString() ) |
3 |
Trace.record( Annotation.ClientSend() ) |
The ZipkinResponseFilter does the reverse to ZipkinRequestFilter and extract the Trace Id from the request headers (ZipkinResponseFilter.scala):
01 |
package com.example.zipkin.client |
03 |
import javax.ws.rs.client.ClientResponseFilter |
04 |
import javax.ws.rs.client.ClientRequestContext |
05 |
import javax.ws.rs.client.ClientResponseContext |
06 |
import javax.ws.rs.ext.Provider |
07 |
import com.twitter.finagle.tracing.Trace |
08 |
import com.twitter.finagle.tracing.Annotation |
09 |
import com.twitter.finagle.tracing.SpanId |
10 |
import com.twitter.finagle.http.HttpTracing |
11 |
import com.twitter.finagle.tracing.TraceId |
12 |
import com.twitter.finagle.tracing.Flags |
13 |
import com.twitter.finagle.tracing.Tracer |
16 |
class ZipkinResponseFilter( val name: String, val tracer: Tracer ) extendsClientResponseFilter { |
17 |
def filter( requestContext: ClientRequestContext, responseContext: ClientResponseContext ): Unit = { |
18 |
val spanId = SpanId.fromString( requestContext.getHeaders().getFirst( HttpTracing.Header.SpanId ).toString() ) |
20 |
spanId foreach { sid => |
21 |
val traceId = SpanId.fromString( requestContext.getHeaders().getFirst( HttpTracing.Header.TraceId ).toString() ) |
23 |
val parentSpanId = requestContext.getHeaders().getFirst( HttpTracing.Header.ParentSpanId ) match { |
24 |
case s: String => SpanId.fromString( s.toString() ) |
28 |
val sampled = requestContext.getHeaders().getFirst( HttpTracing.Header.Sampled ) match { |
29 |
case s: String => s.toString.toBoolean |
33 |
val flags = Flags( requestContext.getHeaders().getFirst( HttpTracing.Header.Flags ).toString.toLong ) |
34 |
Trace.setId( TraceId( traceId, parentSpanId, sid, Option( sampled ), flags ) ) |
37 |
if( Trace.isActivelyTracing ) { |
38 |
Trace.record( Annotation.ClientRecv() ) |
Strictly speaking, in our example it's not necessary to extract the Trace Id from the request because both filters should be executed by the single thread. But the last line is very important: it marks the end of our trace by saying that client has received the response.
1 |
Trace.record( Annotation.ClientRecv() ) |
What's left is actually the tracer itself (Zipkin.scala):
01 |
package com.example.zipkin |
03 |
import com.twitter.finagle.stats.DefaultStatsReceiver |
04 |
import com.twitter.finagle.zipkin.thrift.ZipkinTracer |
05 |
import com.twitter.finagle.tracing.Trace |
06 |
import javax.ws.rs.ext.Provider |
09 |
lazy val tracer = ZipkinTracer.mk( host = "localhost", port = 9410, DefaultStatsReceiver, 1 ) |
If at this point you are confused what all those traces and spans mean please look through this documentation page, you will get the basic understanding of those concepts.
At this point, there is nothing left on the client side and we are good to move to the server side. Our JAX-RS 2.0 server will expose the single endpoint (PeopleRestService.java):
01 |
package com.example.server.rs; |
03 |
import java.util.Arrays; |
04 |
import java.util.Collection; |
05 |
import java.util.concurrent.Callable; |
07 |
import javax.ws.rs.GET; |
08 |
import javax.ws.rs.Path; |
09 |
import javax.ws.rs.Produces; |
11 |
import com.example.model.Person; |
12 |
import com.example.zipkin.Zipkin; |
15 |
public class PeopleRestService { |
16 |
@Produces( { "application/json" } ) |
18 |
public Collection< Person > getPeople() { |
19 |
return Zipkin.invoke( "DB", "FIND ALL", new Callable< Collection< Person > >() { |
21 |
public Collection<person> call() throws Exception { |
22 |
return Arrays.asList( new Person( "Tom", "Bombdil" ) ); |
As we mentioned before, we will simulate the access to database and generate a child trace by using Zipkin.invoke wrapper (which looks very simple, Zipkin.scala):
01 |
package com.example.zipkin |
03 |
import java.util.concurrent.Callable |
04 |
import com.twitter.finagle.stats.DefaultStatsReceiver |
05 |
import com.twitter.finagle.tracing.Trace |
06 |
import com.twitter.finagle.zipkin.thrift.ZipkinTracer |
07 |
import com.twitter.finagle.tracing.Annotation |
10 |
lazy val tracer = ZipkinTracer.mk( host = "localhost", port = 9410, DefaultStatsReceiver, 1 ) |
12 |
def invoke[ R ]( service: String, method: String, callable: Callable[ R ] ): R = Trace.unwind { |
13 |
Trace.pushTracerAndSetNextId( tracer, false ) |
15 |
Trace.recordRpcname( service, method ); |
16 |
Trace.record( new Annotation.ClientSend() ); |
21 |
Trace.record( new Annotation.ClientRecv() ); |
As we can see, in this case the server itself becomes a client for some other service (database).
The last and most important part of the server is to intercept all HTTP requests, extract the Trace Id from them so it will be possible to associate more data with the trace (annotate the trace). In Apache CXF it's very easy to do by providing own invoker (ZipkinTracingInvoker.scala):
01 |
package com.example.zipkin.server |
03 |
import org.apache.cxf.jaxrs.JAXRSInvoker |
04 |
import com.twitter.finagle.tracing.TraceId |
05 |
import org.apache.cxf.message.Exchange |
06 |
import com.twitter.finagle.tracing.Trace |
07 |
import com.twitter.finagle.tracing.Annotation |
08 |
import org.apache.cxf.jaxrs.model.OperationResourceInfo |
09 |
import org.apache.cxf.jaxrs.ext.MessageContextImpl |
10 |
import com.twitter.finagle.tracing.SpanId |
11 |
import com.twitter.finagle.http.HttpTracing |
12 |
import com.twitter.finagle.tracing.Flags |
13 |
import scala.collection.JavaConversions._ |
14 |
import com.twitter.finagle.tracing.Tracer |
15 |
import javax.inject.Inject |
17 |
class ZipkinTracingInvoker extends JAXRSInvoker { |
18 |
@Inject val tracer: Tracer = null |
20 |
def trace[ R ]( exchange: Exchange )( block: => R ): R = { |
21 |
val context = new MessageContextImpl( exchange.getInMessage() ) |
22 |
Trace.pushTracer( tracer ) |
24 |
val id = Option( exchange.get( classOf[ OperationResourceInfo ] ) ) map { ori => |
25 |
context.getHttpHeaders().getRequestHeader( HttpTracing.Header.SpanId ).toList match { |
26 |
case x :: xs => SpanId.fromString( x ) map { sid => |
27 |
val traceId = context.getHttpHeaders().getRequestHeader( HttpTracing.Header.TraceId ).toList match { |
28 |
case x :: xs => SpanId.fromString( x ) |
32 |
val parentSpanId = context.getHttpHeaders().getRequestHeader( HttpTracing.Header.ParentSpanId ).toList match { |
33 |
case x :: xs => SpanId.fromString( x ) |
37 |
val sampled = context.getHttpHeaders().getRequestHeader( HttpTracing.Header.Sampled ).toList match { |
38 |
case x :: xs => x.toBoolean |
42 |
val flags = context.getHttpHeaders().getRequestHeader( HttpTracing.Header.Flags ).toList match { |
43 |
case x :: xs => Flags( x.toLong ) |
47 |
val id = TraceId( traceId, parentSpanId, sid, Option( sampled ), flags ) |
50 |
if( Trace.isActivelyTracing ) { |
51 |
Trace.recordRpcname( context.getHttpServletRequest().getProtocol(), ori.getHttpMethod() ) |
52 |
Trace.record( Annotation.ServerRecv() ) |
64 |
if( Trace.isActivelyTracing ) { |
65 |
id map { id => Trace.record( new Annotation.ServerSend() ) } |
72 |
override def invoke( exchange: Exchange, parametersList: AnyRef ): AnyRef = { |
73 |
trace( exchange )( super.invoke( exchange, parametersList ) ) |
Basically, the only thing this code does is extracting Trace Id from request and associating it with the current thread. Also please notice that we associate additional data with the trace marking the server participation.
1 |
Trace.recordRpcname( context.getHttpServletRequest().getProtocol(), ori.getHttpMethod() ) |
2 |
Trace.record( Annotation.ServerRecv() ) |
To see the tracing in live, let's start our server (please notice that sbt should be installed), assuming all Zipkin components andApache Zookeeper are already up and running:
sbt 'project server' 'run-main com.example.server.ServerStarter'
then the client:
sbt 'project client' 'run-main com.example.client.ClientStarter'
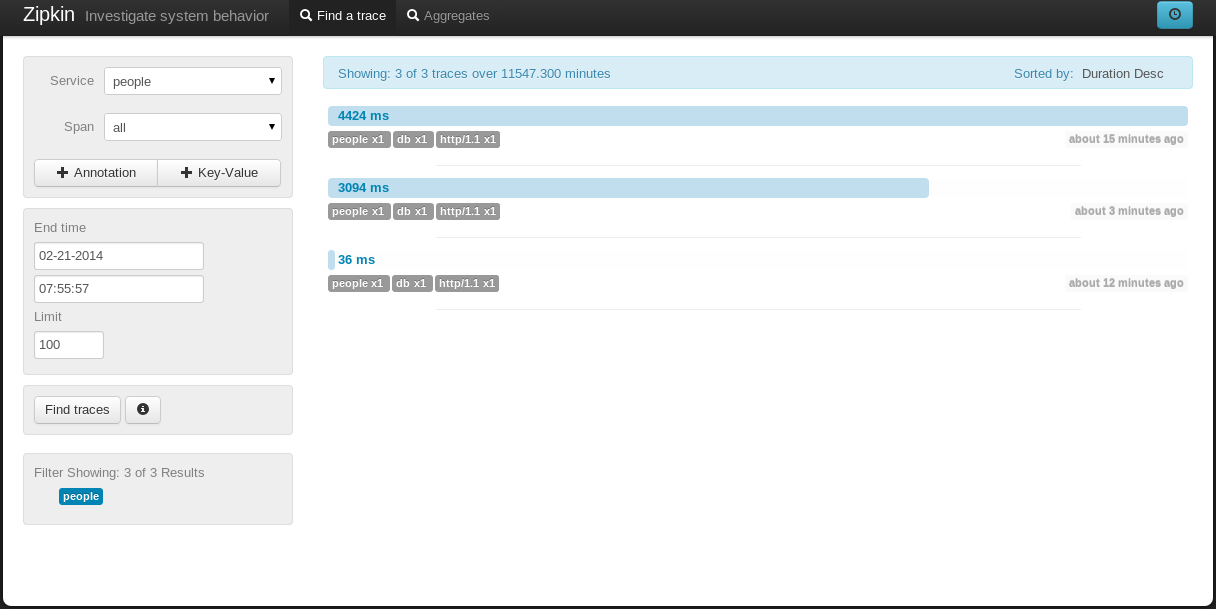
and finally open Zipkin web UI at http://localhost:8080. We should see something like that (depending how many times you have run the client):
Alternatively, we can build and run fat JARs using sbt-assembly plugin:
sbt assembly
java -jar server/target/zipkin-jaxrs-2.0-server-assembly-0.0.1-SNAPSHOT.jar
java -jar client/target/zipkin-jaxrs-2.0-client-assembly-0.0.1-SNAPSHOT.jar
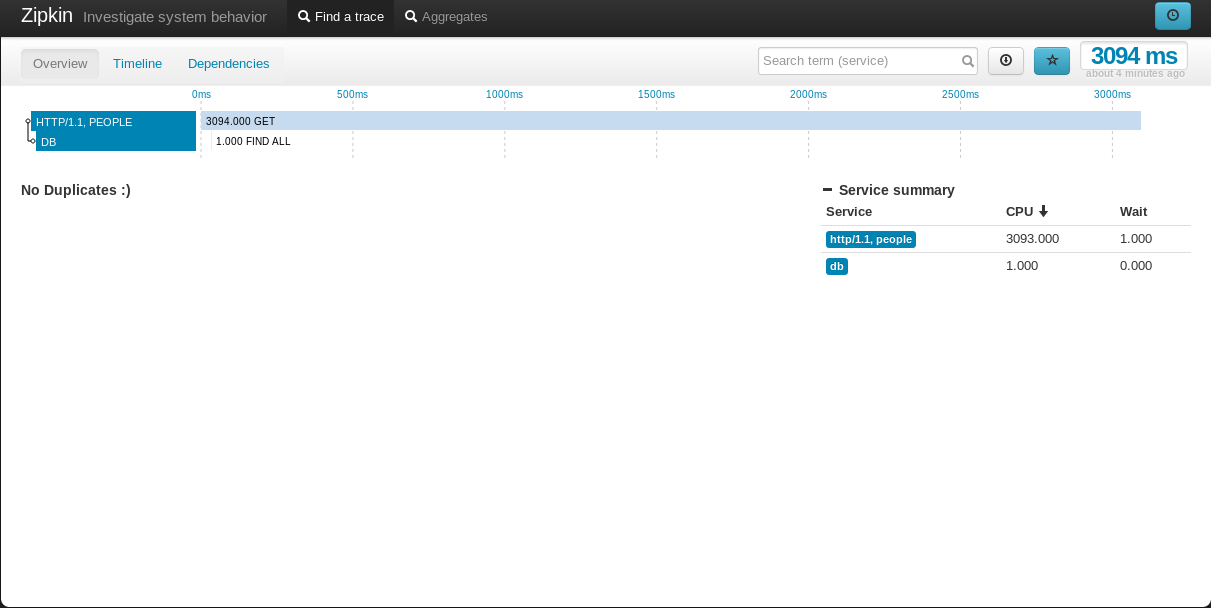
If we click on any particular trace, the more detailed information will be shown, much resembling client <-> server <-> databasechain.
Even more details are shown when we click on particular element in the tree.
Lastly, the bonus part is components / services dependency graph.
As we can see, all the data associated with the trace is here and follows hierarchical structure. The root and child traces are detected and shown, as well as timelines for client send/receive and server receive/send chains. Our example is quite naive and simple, but even like that it demonstrates how powerful and useful distributed system tracing is. Thanks to Zipkin guys.
The complete source code is available on GitHub.