Node Exporter部署
在Prometheus的架构设计中,Prometheus Server并不直接服务监控特定的目标,其主要任务负责数据的收集,存储并且对外提供数据查询支持。因此为了能够监控到某些东西,如主机的cpu使用率,我们需要使用到Exporter。Prometheus周期性的从Exporter暴露的HTTP服务地址(通常时metrics)拉取监控样本数据。
Node Exporter可以采集到系统相关的信息,例如CPU、内存、硬盘等系统信息。Node Exporter采用Golang编写,并且不存在任何的第三方依赖,只需要下载,解压即可运行。
1、下载部署:
[root@localhost ~]# wget https://github.com/prometheus/node_exporter/releases/download/v0.18.1/node_exporter-0.18.1.linux-amd64.tar.gz
[root@localhost ~]# tar zxf node_exporter-0.18.1.linux-amd64.tar.gz -C /usr/local/
[root@localhost ~]# cd /usr/local/
[root@localhost local]# mv node_exporter-0.18.1.linux-amd64 node_exporter
2、添加服务到systemctl
[root@localhost ~]# vim /etc/systemd/system/node_exporter.service
[Unit]
Description=node exporter
Documentation=node exporter
[Service]
ExecStart=/usr/local/node_exporter/node_exporter
[Install]
WantedBy=multi-user.target
[root@localhost local]# systemctl start node_exporter
[root@localhost local]# systemctl enable node_exporter
[root@localhost local]# ss -tunlp|grep node_exporter
tcp LISTEN 0 128 [::]:9100 [::]:* users:(("node_exporter",pid=20063,fd=3))
3、访问web界面查看以下,监控状态:http://192.168.10.121:9100/metrics
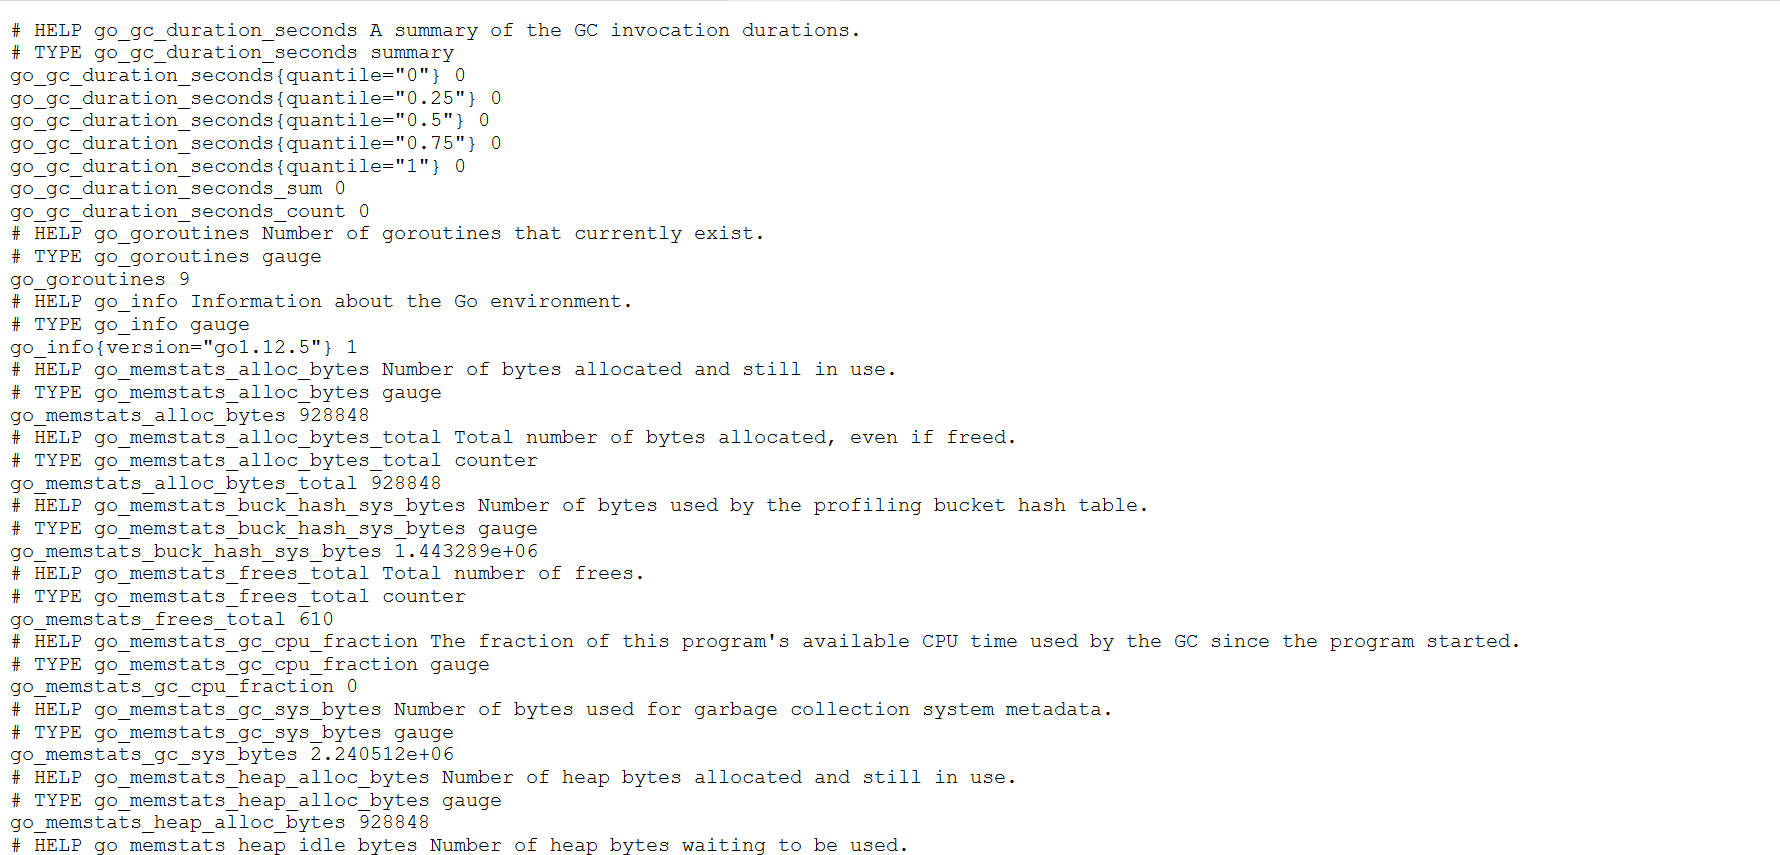
在web界面上我们可以看到很多相关的系统指标,从指标中我们可以获得类似相关参数指标信息:
node_boot_time:系统启动时间
node_cpu:系统CPU使用量
nodedisk:磁盘IO
nodefilesystem:文件系统用量
node_load1:系统负载
nodememeory:内存使用量
nodenetwork:网络带宽
nodetime:当前系统时间
go:node exporter中go相关指标
process_:node exporter自身进程相关运行指标
4、docker启动方法:
docker run -d -p 9100:9100 quay.io/prometheus/node-exporter
5、修gapprometheus配置文件
[root@localhost ~]# vim /usr/local/prometheus/prometheus.yml
# my global config
global:
scrape_interval: 15s # Set the scrape interval to every 15 seconds. Default is every 1 minute.
evaluation_interval: 15s # Evaluate rules every 15 seconds. The default is every 1 minute.
# scrape_timeout is set to the global default (10s).
# Alertmanager configuration
alerting:
alertmanagers:
- static_configs:
- targets:
# - alertmanager:9093
# Load rules once and periodically evaluate them according to the global 'evaluation_interval'.
rule_files:
# - "first_rules.yml"
# - "second_rules.yml"
# A scrape configuration containing exactly one endpoint to scrape:
# Here it's Prometheus itself.
scrape_configs:
# The job name is added as a label `job=<job_name>` to any timeseries scraped from this config.
- job_name: 'prometheus'
# metrics_path defaults to '/metrics'
# scheme defaults to 'http'.
static_configs:
- targets: ['localhost:9090']
- job_name: 'linux'
static_configs:
- targets: ['192.168.10.121']
[root@localhost ~]# systemctl restart prometheus
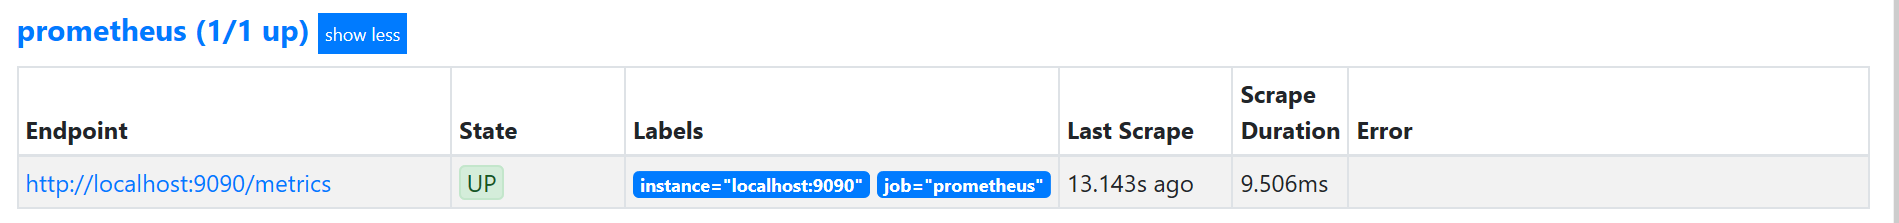
浏览器查看

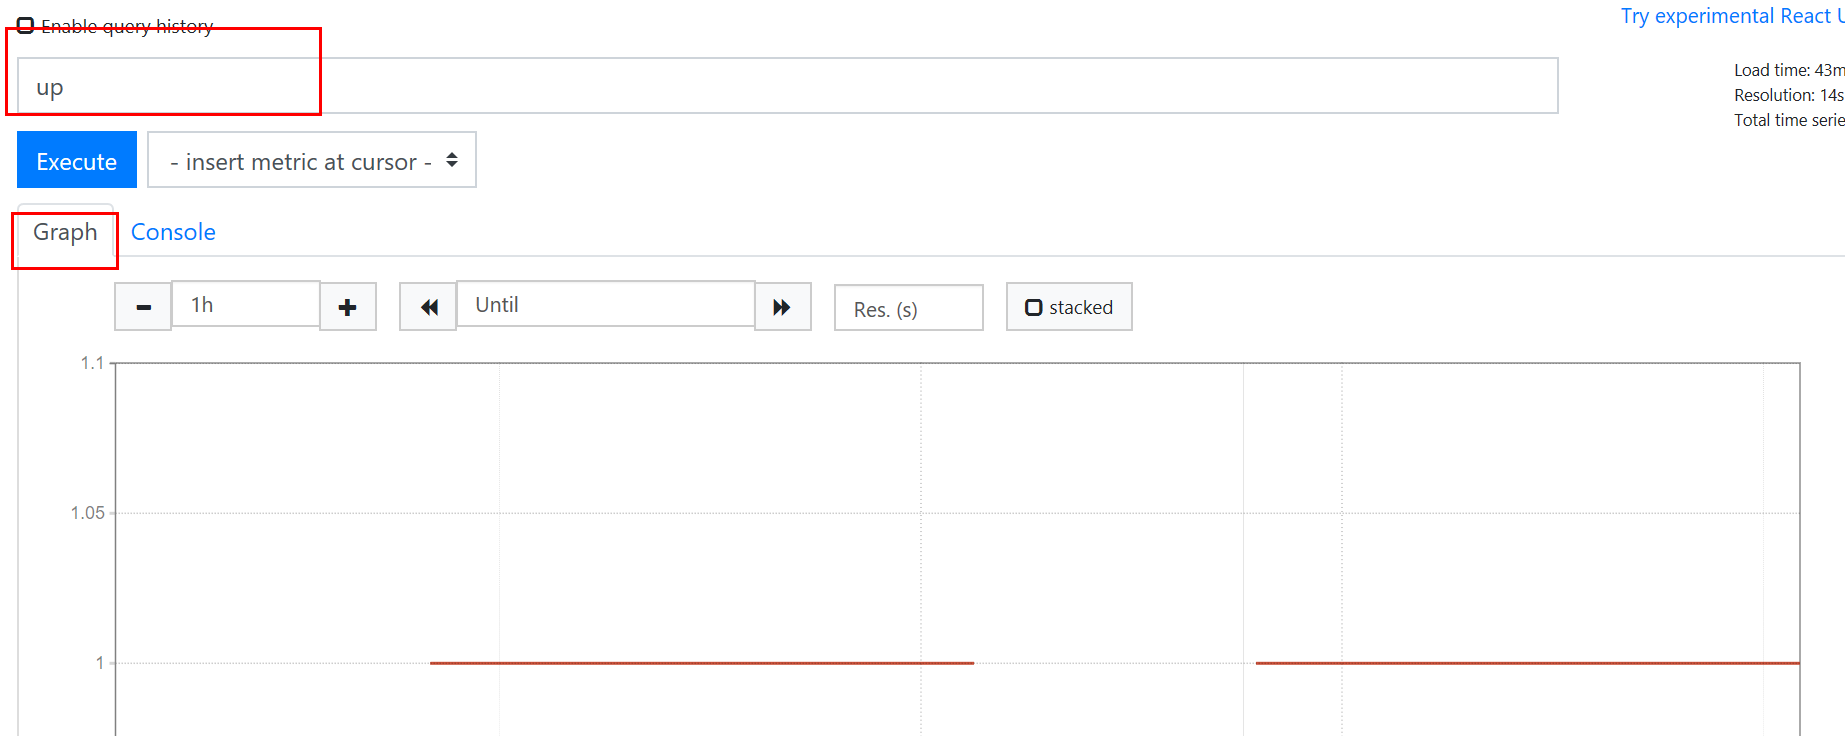
#1:表示任务正常,0:表示异常
总结:
Prometheus server和采集系统相关资源指标的node exporter已经安装完成,并且已经成功拉取到了数据存储在服务端。
在构建一个完整的监控的时候,我们还需要用仪表展示和告警规则、邮件、微信告警媒介,就可以完成大致的流程
6、node-exporter常用指标类型:
node_cpu:系统CPU使用量
node_disk*:磁盘IO
node_filesystem*:文件系统用量
node_load1:系统负载
node_memeory*:内存使用量
node_network*:网络带宽
node_time:当前系统时间
go_*:node exporter中go相关指标
process_*:node exporter自身进程相关运行指标
7、进程监控:Process-exporter
由于我们常用的node_exporter并不能覆盖所有进程细化监控项,这里我们使用Process-exporter对进程进行监控。
7.1 Process-exporter下载安装
[root@localhost ~]# wget https://github.com/ncabatoff/process-exporter/releases/download/v0.5.0/process-exporter-0.5.0.linux-amd64.tar.gz
[root@localhost ~]# tar zxf process-exporter-0.5.0.linux-amd64.tar.gz
[root@localhost ~]# mv process-exporter-0.5.0.linux-amd64 /usr/local/process-exporter
7.2 添加服务到启动中并启动
[root@localhost ~]# vim /etc/systemd/system/process-exporter.service
[Unit]
Description=node exporter
Documentation=node exporter
[Service]
ExecStart=/usr/local/process-exporter/process-exporter -config.path /usr/local/process-exporter/process-name.yaml
[Install]
WantedBy=multi-user.target
7.3配置文件匹配规则
配置文件根据变量名匹配到配置文件:
{{.Comm}} 包含原始可执行文件的basename,/proc//stat 中的换句话说,2nd 字段
{{.ExeBase}} 包含可执行文件的basename
{{.ExeFull}} 包含可执行文件的完全限定路径
{{.Matches}} 映射包含应用命令行tlb所产生的所有匹配项
8 监控nginx示例:
Process-exporter 可以进程名字匹配进程,获取进程信息。匹配规则由name对应的模板变量决定,以下表示监控进程名字为nginx (前提是我们已经安装了nginx服务,并且已经启动)
[root@localhost ~]# yum -y install nginx
[root@localhost ~]# systemctl start nginx
[root@localhost ~]# systemctl enable nginx
[root@localhost ~]# netstat -tunlp|grep nginx
配置nginx的配置文件
[root@localhost ~]# vim /usr/local/process-exporter/process-name.yaml
process_names:
- name: "{{.Matches}}"
cmdline:
- 'nginx'
[root@localhost ~]# systemctl start process-exporter.service
[root@localhost ~]# systemctl enable process-exporter.service
[root@localhost ~]# vim /usr/local/prometheus/prometheus.yml
- job_name: 'process'
static_configs:
- targets: ['192.168.10.121:9256']
[root@localhost ~]# systemctl restart prometheus
[root@localhost ~]# systemctl status prometheus
#查看新加入的指标监控状态
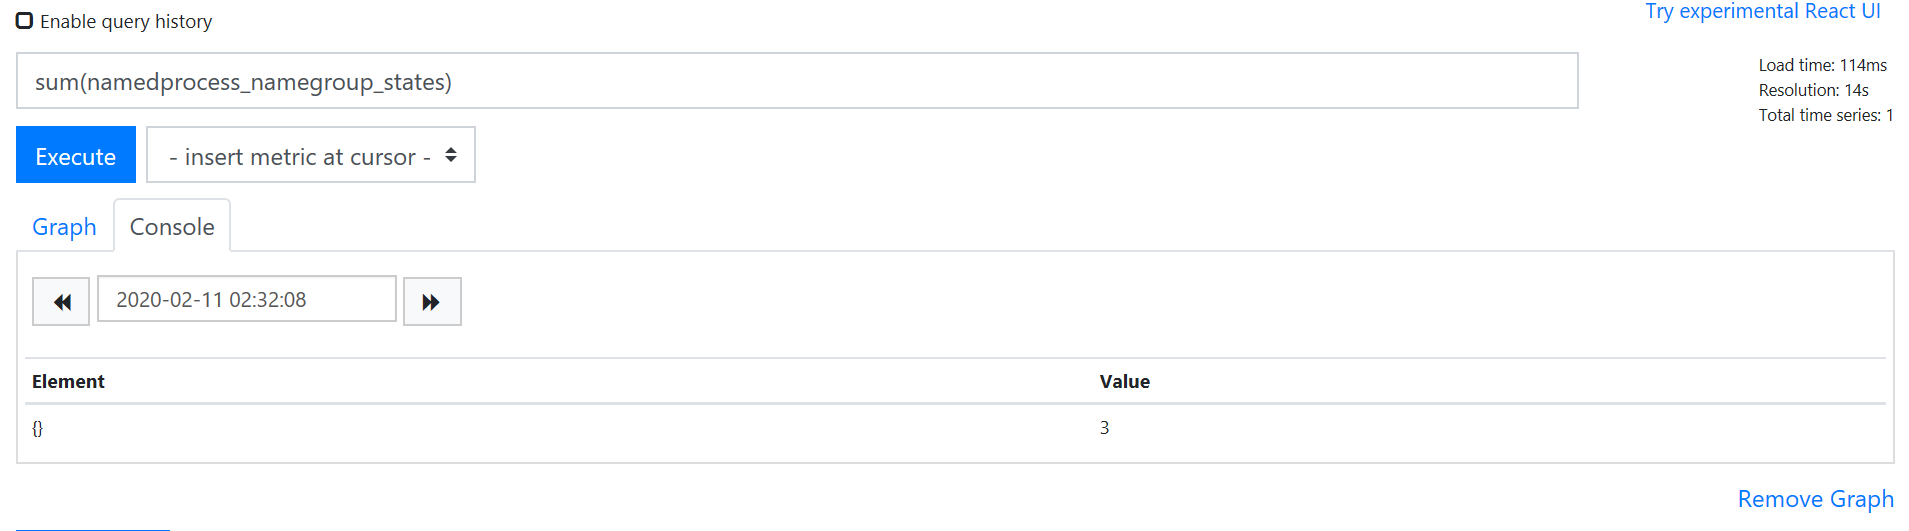
查看相关监控项
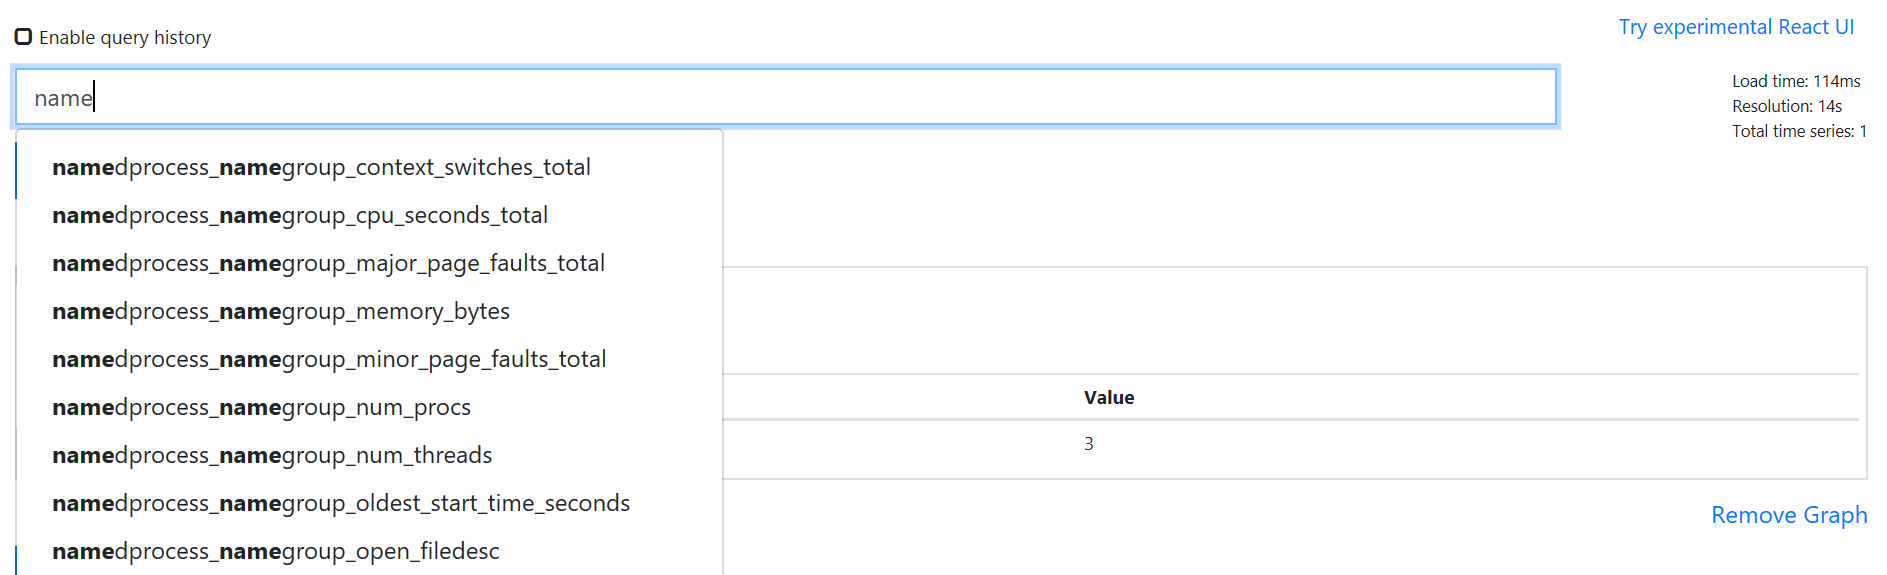
统计有多少个进程数:sum(namedprocess_namegroup_states)
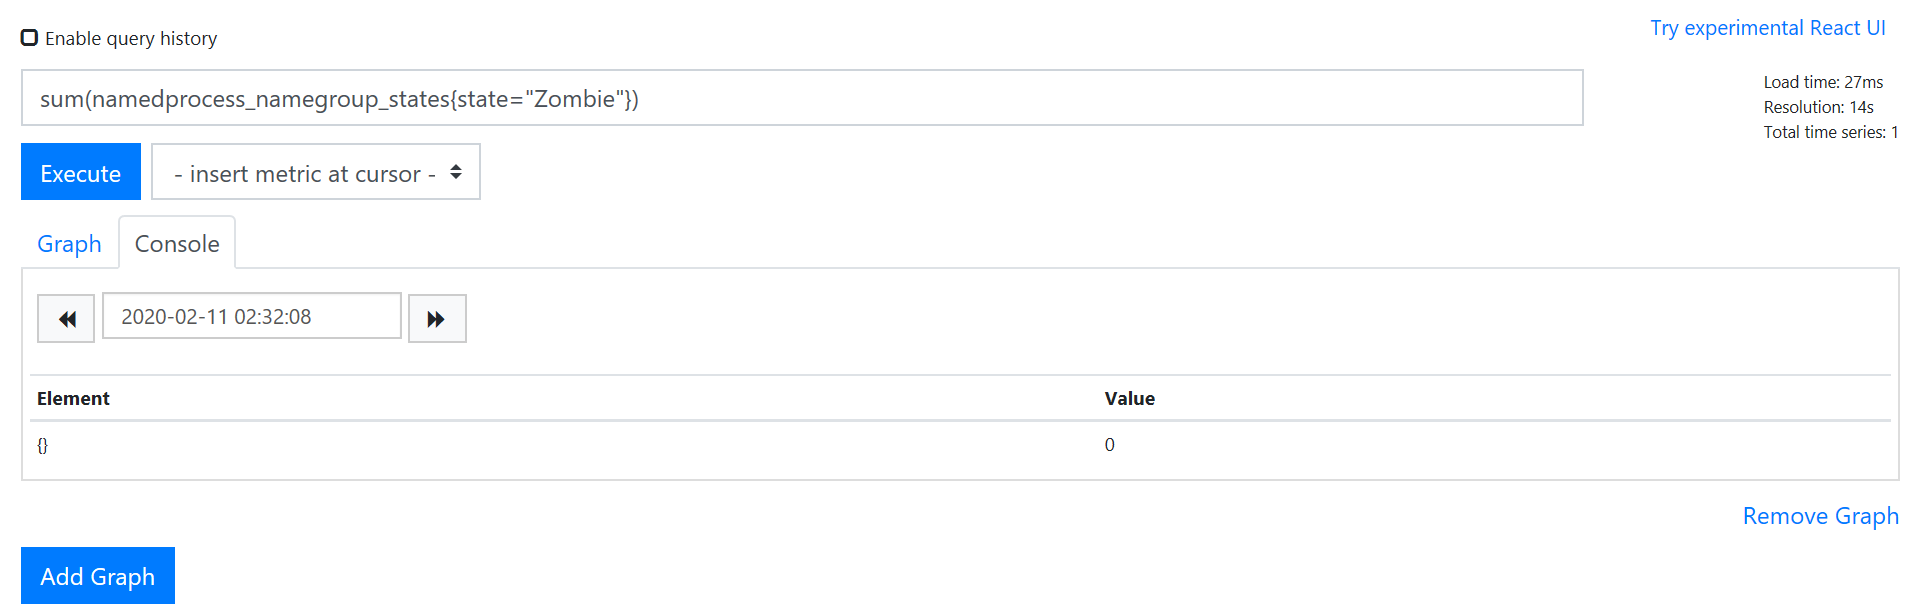
统计有多少个僵尸进程:sum(namedprocess_namegroup_states{state="Zombie"})
9、Node-exporter自定义Key:
前面我们已经添加了操作系统监控,进程监控,那么一款优秀的开源软件,在自定义key方面应该时非常强大的,例如zabbix的自定义key。在prometheus里面其实也是一样的,在后期我们可以使用client SDK通过程序生成数据。
9.1 node-exporter自定义key原理
实际上node-exporter读取自定义key定时从指定的目录里面读取相关的key值、文件名称以*.prom来查看,定时读取相关参数,下面时以一个用户登录数为例: