1 iftop:
如果你想看到现在你的带宽到底是哪些应用在使用,并且各个应用占据了多少带宽的时候,可以用iftop显示出来.使用的参数如下:
-h display this message
-n don't do hostname lookups
-N don't convert port numbers to services
-p run in promiscuous mode (show traffic between other
hosts on the same network segment)
-b don't display a bar graph of traffic
-B Display bandwidth in bytes
-i interface listen on named interface
-f filter code use filter code to select packets to count
(default: none, but only IP packets are counted)
-F net/mask show traffic flows in/out of IPv4 network
-G net6/mask6 show traffic flows in/out of IPv6 network
-l display and count link-local IPv6 traffic (default: off)
-P show ports as well as hosts
-m limit sets the upper limit for the bandwidth scale
-c config file specifies an alternative configuration file
-t use text interface without ncurses
Sorting orders:
-o 2s Sort by first column (2s traffic average)
-o 10s Sort by second column (10s traffic average) [default]
-o 40s Sort by third column (40s traffic average)
-o source Sort by source address
-o destination Sort by destination address
The following options are only available in combination with -t
-s num print one single text output afer num seconds, then quit
-L num number of lines to print
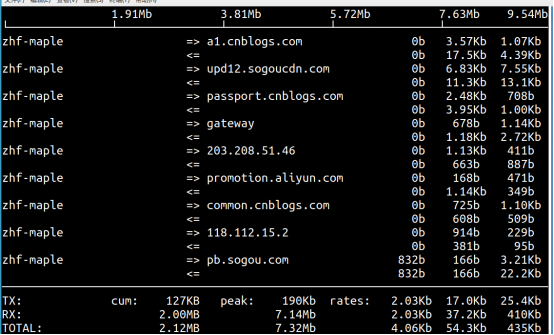
如果你只有一个网络接口,直接运行iftop就可以了,如果你有多个则需要通过-i来指定比如我们的使用iftop -i wlp2s0.显示如下,左边一列是源地址,显示的是域名.中间则是显示的目的地址也就是使用的网络,后面则是速率
最下面还展示了接受和发出的包大小.以及总共的计算.
在页面中你也可以在命令运行时更改显示选项:
h 切换帮助界面
n 是否解析域名
s 切换源地址显示
S 是否显示端口号
t 切换文本显示界面
p 暂停显示更新
q 推出程序
N 是否解析端口
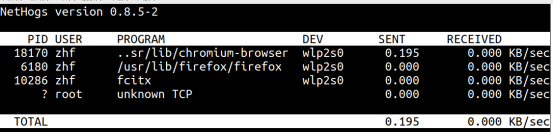
nethogs:
nethogs是个快速而简单的方法,需要用root身份制定要监听的接口,它会显示应用程序以及进程号,所以在你想杀死某个进程的时候,你可以通过这个命令查找到进程号.
nethogs的命令参数如下:
Options
-h display available commands usage.
-V prints Version info.
-d delay for refresh rate.
-v select view mode
-p sniff in promiscious mode (not recommended).
-t tracemode.
-c limit number of refreshes
-s sort by traffic sent
显示页面的命令比较少,只有如下几个:
m cycle between display modes (kb/s, kb, b, mb)
r sort by 'received'
s sort by 'sent'
q quit
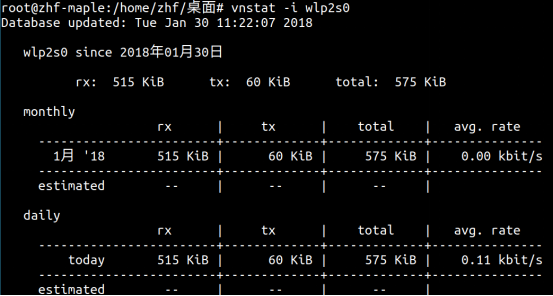
vnstat:
vnstat实时的显示所有的网络数据.
你也可以通过这几种方式过滤数据显示:
-h: 按小时显示统计信息
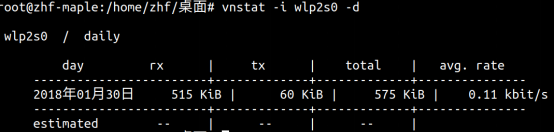
-d 按天显示统计信息
-w 按周显示信息
-m 按月显示信息
-l 查看实时更新