promtool工具探索
Prometheus提供了一个非常有用的支持命令行工具promtool。这个小型的Golang二进制文件可用于快速执行几个故障排除操作,并且包含了许多有用的子命令。
1.检查
属于这个类别的子命令为用户提供了检查和验证Prometheus服务器的几个配置方面和度量标准遵守从性的能力。
1.1检查配置
promtool提供了几种类型的检查。其中最有价值的是检查Prometheus服务器的著配置文件。
检查配置时,0表示成功,1表示失败。
案例如下:
$ promtool check config /etc/prometheus/prometheus.yml
Checking /etc/prometheus/prometheus.yml
	SUCCESS: 1 rule files found

Checking /etc/prometheus/first_rules.yml
	SUCCESS: 1 rule rules found
1.2规则检查
check rules 分析并确定规则配置文件中的错误配置。它允许直接真对特定的规则文件,这允许您测试在主Prometheus配置中尚未引用的文件。这种能力对于规则文件的开发周期和在使用配置管理时验证上述文件中的自动更改非常方便。
案例如下:
$ promtool check rules /rules/prometheus/first_rules.yml
Checking /etc/prometheus/first_rules.yml
	SUCCESS: 1 rule rules found
1.3度量值检查
check metrics 子命令验证传递给他的度量在一致性和正确性方面是否遵循Prometheus准则。
$ curl -s http://prometheus:9090/metrics | promtool check metrics
prometheus_tsdb_storage_blocks_bytes_total non-counter should not have "_total" suffix
可以看到,prometheus_tsdb_storage_blocks_bytes_total度量似乎有问题。让我们看看这个特殊的度量来排除错误:
$ curl -s http://prometheus:9090/metrics | grep prometheus_tsdb_storage_blocks_bytes_total
# HELP prometheus_tsdb_storage_blocks_bytes_total The number of bytes that are currently used for jocal storage by all blocks.
# TYPE prometheus_tsdb_storage_blocks_bytes_total guage
prometheus_tsdb_storage_blocks_bytes_total 0
2. 查询
属于这个类别的子命令允许直接从命令行执行PromQL表达式。这些查询依赖于Prometheus公共HTTP API。下面的主题将演示如何使用它们。
2.1查询实例
query instant 子命令允许根据当前时间通过命令行直接查询Prometheus服务器。要使其工作,必须提供一个Prometheus服务器URL作为参数,以及要执行的查询,就像这样。
$ promtool query instant 'http://prometheus:9090' 'up == 1'

'''
up{group="Retail", instance="http://192.168.1.102:80", job="blackbox-http"} => 1 @[1637019176.876]
up{group="Retail", instance="https://baidu.com", job="blackbox-http"} => 1 @[1637019176.876]
up{instance="192.168.1.121:8080", job="docker"} => 1 @[1637019176.876]
up{instance="192.168.1.121:9090", job="prometheus"} => 1 @[1637019176.876]
up{instance="192.168.1.121:9100", job="node"} => 1 @[1637019176.876]
'''
2.2 查询范围
与前面的子命令类似,查询范围允许在指定的时间范围内显示结果。因此,我们必须提供开始和结束unix格式的时间戳,以及查询和Prometheus服务器端点。
例如,我们将使用date命令来定义开始和结束时间戳,生成五分钟前的unix格式时间戳和现在的另一个时间戳。我们还可以使用--step标志指定查询的解析,在我们的示例中,它是一分钟。最后,我们防止PromQL表达式来执行,最后得到一个类似下面的指令:
$ promtool query range --start=$(date -d '5minutes ago' +'%s') --end=$(date -d 'now' +'%s') --step=1m 'http://prometheus:9090'
2.3 query series
使用query series可以搜索与一组度量名称和标签匹配的所有时间序列。以下是使用方法:
$ promtool query series 'http://prometheus:9090' --match='up' --match='go_info{job="prometheus"}'

{__name__="go_info", instance="192.168.1.121:9090", job="prometheus", version="go1.17.3"}
{__name__="go_info", instance="zhang.com:9090", job="prometheus", version="go1.17.3"}
{__name__="up", group="Retail", instance="http://192.168.1.102:80", job="blackbox-http"}
2.4query labels
使用查询标签,您可以跨所有可用的指标搜索特定的标签,并返回附加到它的所有可能的值;例如:
$ promtool query labels 'http://prometheus:9090' 'mountpoint'

/
/boot
/run
/run/user/0
3. Debug
属于这个类别的子命令允许从运行的Prometheus服务器提取调试数据,以便对其进行分析。接下来我们将演示如何使用它们。
3.1 debug pprof
$ promtool debug pprof 'http://prometheus:9090'

collecting: http://192.168.1.121:9090/debug/pprof/profile?seconds=30
collecting: http://192.168.1.121:9090/debug/pprof/block
collecting: http://192.168.1.121:9090/debug/pprof/goroutine
collecting: http://192.168.1.121:9090/debug/pprof/heap
collecting: http://192.168.1.121:9090/debug/pprof/mutex
collecting: http://192.168.1.121:9090/debug/pprof/threadcreate
collecting: http://192.168.1.121:9090/debug/pprof/trace?seconds=30
Compiling debug information complete, all files written in "debug.tar.gz".
当我们提取前一个命令生成的存档文件时,我们可以看到几个文件:
$ tar xzvf debug.tar.gz
cpu.pb
tar: cpu.pb: implausibly old time stamp 1970-01-01 08:00:00
block.pb
tar: block.pb: implausibly old time stamp 1970-01-01 08:00:00
goroutine.pb
tar: goroutine.pb: implausibly old time stamp 1970-01-01 08:00:00
heap.pb
tar: heap.pb: implausibly old time stamp 1970-01-01 08:00:00
mutex.pb
tar: mutex.pb: implausibly old time stamp 1970-01-01 08:00:00
threadcreate.pb
tar: threadcreate.pb: implausibly old time stamp 1970-01-01 08:00:00
trace.pb
tar: trace.pb: implausibly old time stamp 1970-01-01 08:00:00
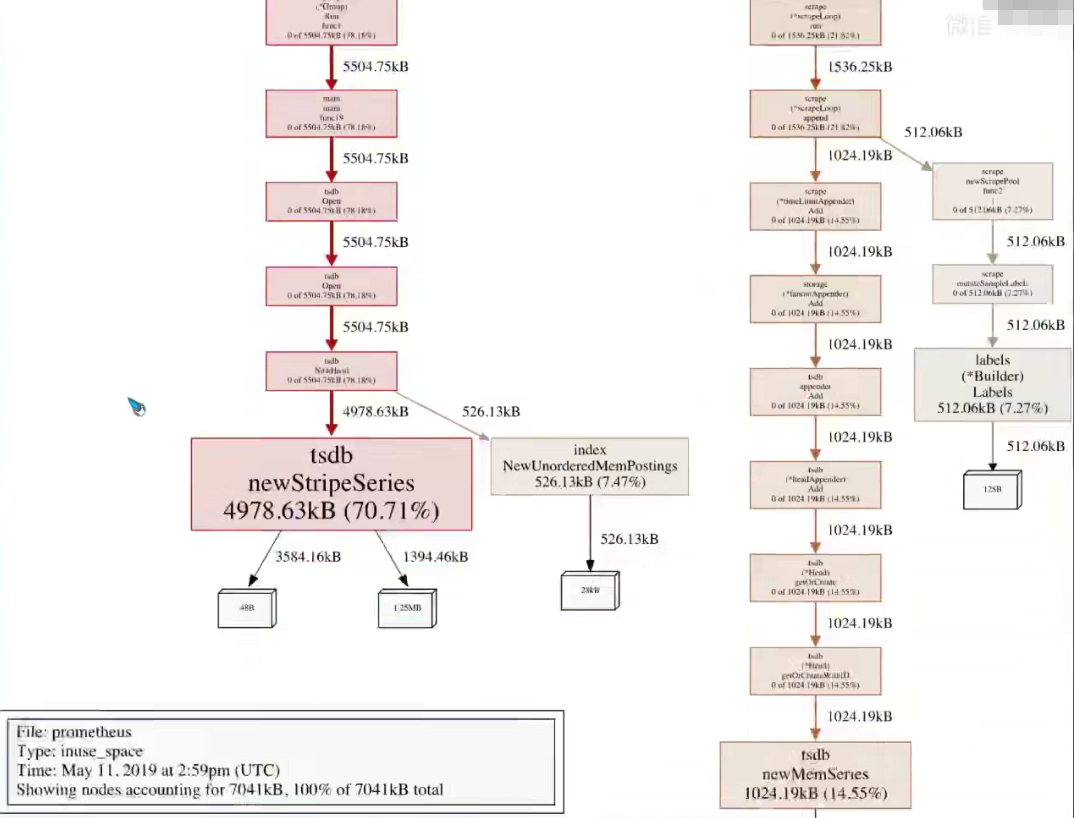
使用pprof,我们可以生成转储的镜像,在下一个代码片段中我们可以管擦到这一点。
$ pprof -svg heap.pb > /vagrant/cache/heap.svg
在主机上,在./cache/路径(相对于存储库根)下的代码存储库中,您现在应该有一个可伸缩的向量图形文件heap。可由浏览器打开以供查看。下main的截图显示了你可能会看到什么时,看看由上述例子产生的文件:
3.2 debug metrics
此子命令下载提供的Prometheus示例在压缩归档中公开的度量。调试指标并不常用,因为/metrics Prometheus端点对于任何能够运行此命令的人都是可用的;它的存在是为了在需要时更容易地向外部援助(例如Prometheus的维护者)提供Prometheus实例的当前状态。这个子命令可以使用如下:
$ promtool debug metrics 'http://prometheus:9090'
collecting: http://192.168.1.121:9090/metrics
Compiling debug information complete, all files written in "debug.tar.gz".

tar xzvf debug.tar.gz
metrics.txt

tail -n 5 metrics.txt
# HELP promhttp_metric_handler_requests_total Total number of scrapes by HTTP status code.
# TYPE promhttp_metric_handler_requests_total counter
promhttp_metric_handler_requests_total{code="200"} 3786
promhttp_metric_handler_requests_total{code="500"} 0
promhttp_metric_handler_requests_total{code="503"} 0
3.3 debug all
该选项将之前的调试子命令聚合为一条指令,如下例所示:
$ promtool debug all 'http://prometheus:9090'

collecting: http://192.168.1.121:9090/debug/pprof/mutex
collecting: http://192.168.1.121:9090/debug/pprof/threadcreate
collecting: http://192.168.1.121:9090/debug/pprof/profile?seconds=30
collecting: http://192.168.1.121:9090/debug/pprof/block
collecting: http://192.168.1.121:9090/debug/pprof/goroutine
collecting: http://192.168.1.121:9090/debug/pprof/heap
collecting: http://192.168.1.121:9090/debug/pprof/trace?seconds=30
collecting: http://192.168.1.121:9090/metrics
Compiling debug information complete, all files written in "debug.tar.gz".
4.Endpoints
检查Prometheus是否启动并运行通常非常简单,因为它遵循了大多数云本地应用程序用于服务健康状况的惯例:一个端点检查服务是否健康,另一个端点检查服务是否准备好开始处理传入的请求。对于哪些过去使用或曾经使用过Kubernetes的人来说,这些可能听起来很熟悉;实际上,Kubernetes还使用这些约定来评估是否需要重新启动容器(例如,如果应用程序思索并停止响应健康状况探测),以及是否可以开始向容器发送流量。
在Prometheus中,有/-/healthy 和/-ready 端点。
您可以在测试环境中运行以下命令并检查它们的输出以及它们的HTTP状态码,从而亲自尝试这些端点:
$ curl -w "%{http_code}\n" http://localhost:9090/-/healthy
Prometheus is Healthy.
200

$ curl -w "%{http_code}/n" http://localhost:9090/-/ready
Prometheus is Ready.
200
此外,Prometheus公开了一个/debug/pprof/ endpoint,promtool debug pprof 命令使用了这个端点,如前一节所示。这个端点还公开了一个可导航的web UI,可以在其中查询pprof调试信息,比如当前goroutines及其堆栈跟踪、堆分配、内存分配等;
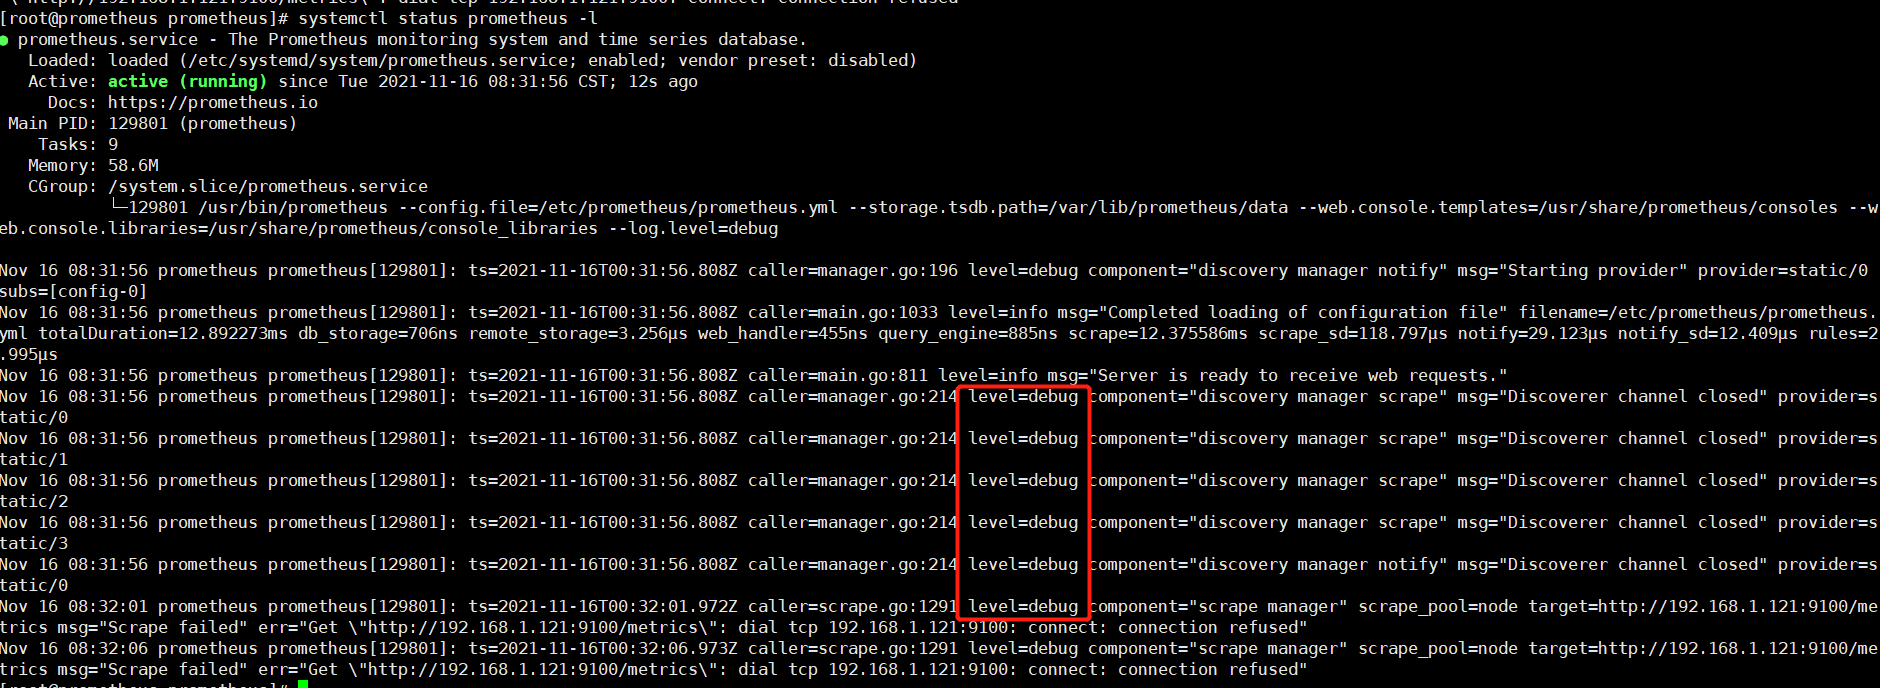
5.Logs
通过 --log.level选项来设置日志级别。
查看配置日志级别:
$ sudo systemctl cat prometheus.service

ExecStart=/usr/bin/prometheus \
        --log.level=debug
        --config.file=/etc/prometheus/prometheus.yml \
        --storage.tsdb.path=/var/lib/prometheus/data \
        --web.console.templates=/usr/share/prometheus/consoles \
        --web.console.libraries=/usr/share/prometheus/console_libraries \
        --log.level=debug
sudo service node_exporter stop
sudo journalctl -fu prometheus | grep dubug