import matplotlib.pyplot as plt
# 用来正常显示中文标签
plt.rcParams['font.sans-serif'] = ['SimHei']
date = ['2018/7/21', '2018/7/22', '2018/7/23', '2018/7/24', '2018/7/25', '2018/7/26', '2018/7/27', '2018/7/28',
'2018/7/29', '2018/7/30', '2018/7/31']
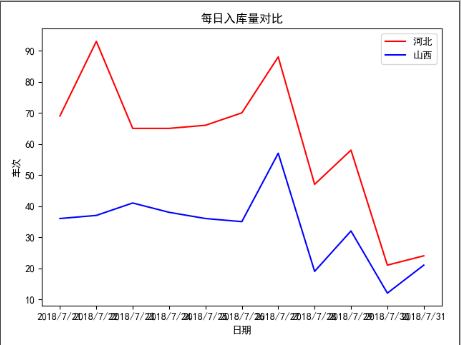
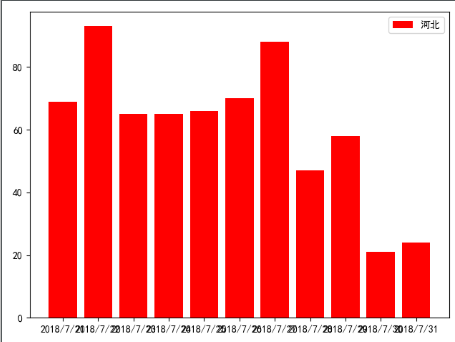
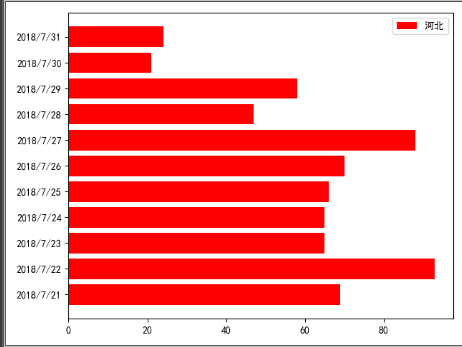
hebei = [69, 93, 65, 65, 66, 70, 88, 47, 58, 21, 24]
shanxi = [36, 37, 41, 38, 36, 35, 57, 19, 32, 12, 21]
# 折线图
plt.plot(date, hebei, color='red', label='河北')
plt.plot(date, shanxi, color='blue', label='山西')
# 标题
plt.title("每日入库量对比")
# 横坐标
plt.xlabel("日期")
# 纵坐标
plt.ylabel("车次")
# 刻印
plt.legend()
# 展示
plt.show()
# 垂直柱状图
plt.bar(date, hebei, color='red', label='河北')
plt.legend()
plt.show()
# 水平柱状图
plt.barh(date, hebei, color='red', label='河北')
plt.legend()
plt.show()
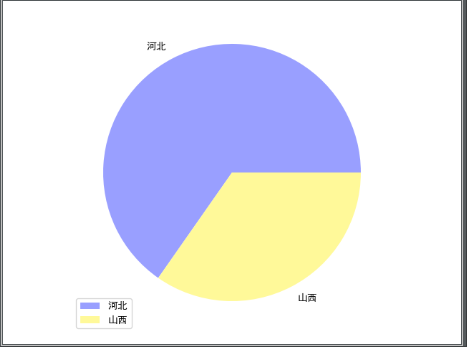
# 饼图
number = [666, 354]
province = ['河北', '山西']
colors = ['#999fff', '#fff999']
plt.pie(x=number, labels=province, colors=colors)
plt.legend()
plt.show()