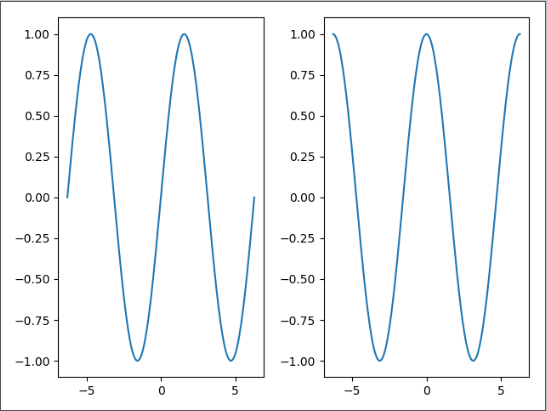
1、函数subplot()的使用方法
 1 import matplotlib.pyplot as plt
 2 import numpy as np
 3
 4 x = np.linspace(-2*np.pi,2*np.pi,200)
 5 y1 = np.sin(x)
 6 y2 = np.cos(x)
 7
 8 plt.subplot(121)
 9 plt.plot(x,y1)
10
11 plt.subplot(122)
12 plt.plot(x,y2)
13
14 plt.show()
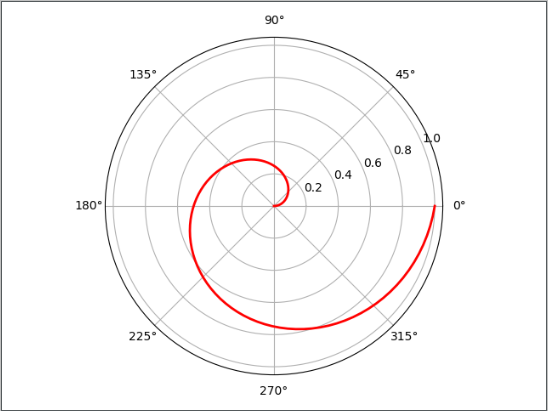
2、在极坐标轴上绘制折线图
 1 import matplotlib.pyplot as plt
 2 import numpy as np
 3
 4 radii = np.linspace(0,1,100)
 5 theta = 2 * np.pi * radii       # θ=2*np.pi*半径
 6
 7 fig = plt.subplot(111,          # 1行1列第一个子区
 8                   polar=True)   # 在极坐标上绘制
 9 fig.plot(theta,                 # 表达式
10          radii,                 # 半径
11          color="r",             # 折线条颜色
12          linestyle="-",         # 线条样式
13          linewidth=2)           # 线条宽度
14 plt.show()
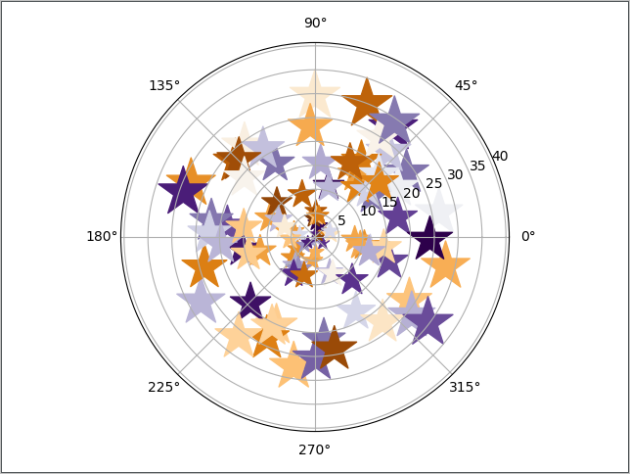
3、在极坐标轴上绘制散点图
 1 import matplotlib.pyplot as plt
 2 import numpy as np
 3 import matplotlib
 4
 5 radii = 30 * np.random.rand(100)
 6 theta = 2 * np.pi * np.random.rand(100)
 7 colors = np.random.rand(100)
 8 size = 50 * radii
 9
10 fig = plt.subplot(111,                  # 1行1列第1个子区
11                   polar=True)           # 在极坐标轴上绘制
12 # 在极坐标轴上绘制散点图
13 fig.scatter(theta,                      # 表达式
14             radii,                      # 半径
15             s=size,                     # 散点图大小
16             c=colors,                   # 散点图颜色
17             cmap=matplotlib.cm.PuOr,    # 使用颜色映射表PuOr对散点进行着色
18             marker="*")                 # 散点图样式
19 plt.show()
4、在非等分的绘图区域上实现绘图展示
 1 import matplotlib.pyplot as plt
 2 import numpy as np
 3
 4 fig = plt.figure()
 5
 6 x = np.linspace(0.0,2*np.pi)
 7 y = np.cos(x) * np.sin(x)
 8
 9 ax1 = fig.add_subplot(121)
10 ax1.margins(0.03)
11 ax1.plot(x,y,ls="-",lw="2",color="b")
12
13 ax2 = fig.add_subplot(222)
14 ax2.margins(0.7,0.7)
15 ax2.plot(x,y,ls="-",lw="2",color="r")
16
17 ax3 = fig.add_subplot(224)
18 ax3.margins(x=0.1,y=0.3)
19 ax3.plot(x,y,ls="-",lw="2",color="g")
20
21 plt.show()
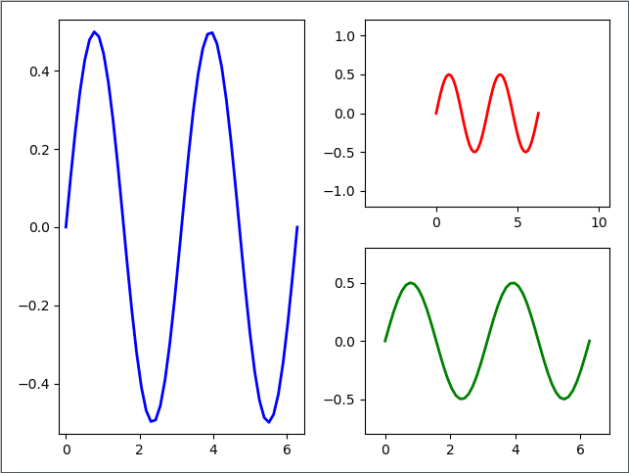
需要注意的是实例方法margins(m)可以设置数据范围的空白区域,也就是说M倍的数据区间会被添加到原来数据区间的两端,数据空白区域的调整类型即包括x轴也包括y轴的数据区间,参数m的取值范围是>-0.5的任意浮点数。
5、函数subplot2grid()的使用方法:让子区跨越固定网格布局
 1 import  matplotlib
 2 import  matplotlib.pyplot as plt
 3 import numpy as np
 4
 5 # 显示中文标识
 6 matplotlib.rcParams["font.sans-serif"] = ["SimHei"]
 7 matplotlib.rcParams["axes.unicode_minus"] = False
 8
 9 plt.subplot2grid(shape=(2,3),   # 2行3列
10                  loc=(0,0),     # 以第1行第1列作为起点
11                  colspan=2)     # 图像占画布列的2个单位
12 x = np.linspace(0.0,4.0,100)
13 y = np.random.randn(100)
14 plt.scatter(x,y,c="c")
15 plt.title("散点图")
16
17 plt.subplot2grid(shape=(2,3),   # 2行3列
18                  loc=(0,2),     # 以第1行第3列作为起点
19                  colspan=1)     # 图像占画布列的1个单位
20 plt.title("空白绘图区域")
21
22 plt.subplot2grid(shape=(2,3),   # 2行3列
23                  loc=(1,0),     # 以第2行第1列作为起点
24                  colspan=3)     # 图像占画布列的3个单位
25 x = np.linspace(0.0,4.0,100)
26 y1 = np.sin(x)
27 plt.plot(x,y1,lw=2,ls="-")
28 plt.xlim(0,3)
29 plt.grid(True,ls=":",c="r")
30 plt.title("折线图")
31
32 # 给整个画布添加标题
33 plt.suptitle("subplot2grid函数的实例展示",fontsize=25)
34 plt.show()

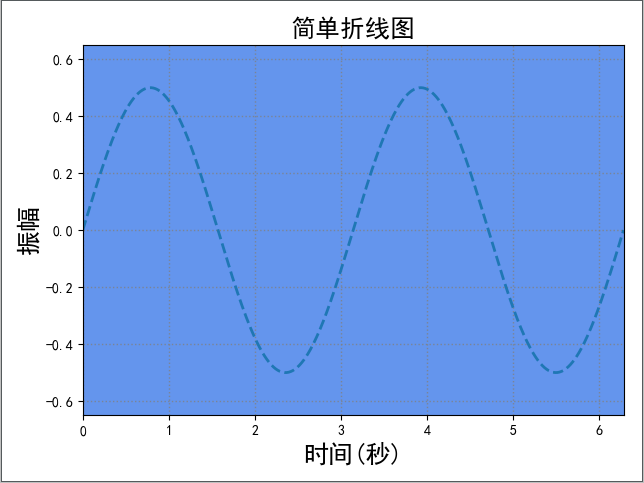
6、创建一张画布和一个子区的绘图模式
 1 import  matplotlib
 2 import  matplotlib.pyplot as plt
 3 import numpy as np
 4
 5 # 显示中文标识
 6 matplotlib.rcParams["font.sans-serif"] = ["SimHei"]
 7 matplotlib.rcParams["axes.unicode_minus"] = False
 8
 9 font_style = dict(fontsize=18,weight="black")
10
11 x = np.linspace(0,2*np.pi,500)
12 y = np.sin(x) * np.cos(x)
13
14 # 返回一个画布对象fig和一个坐标轴实例ax,subplot_kw:设置坐标轴的背景颜色
15 fig, ax = plt.subplots(1,1,subplot_kw=dict(facecolor="cornflowerblue"))
16 ax.plot(x,y,"k--",lw=2)
17 ax.set_xlabel("时间(秒)",**font_style)
18 ax.set_ylabel("振幅",**font_style)
19 ax.set_title("简单折线图",**font_style)
20
21 ax.set_xlim(0,2*np.pi)
22 ax.set_ylim(-0.65,0.65)
23
24 ax.grid(ls=":",lw=1,color="gray",alpha=0.8)
25
26 plt.show()
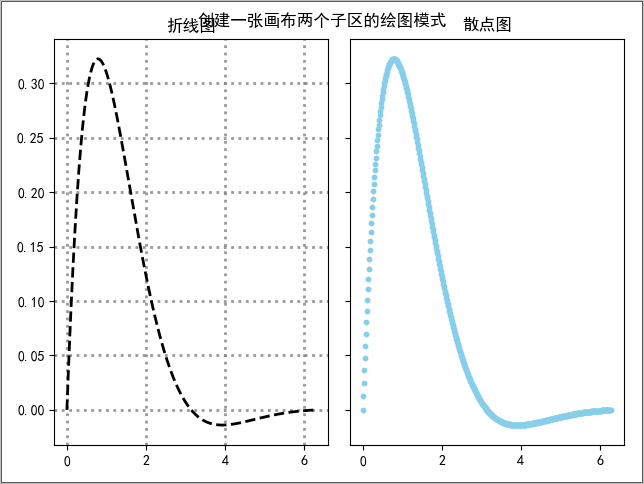
7、创建一张画布和两个子区的绘图模式
 1 import  matplotlib
 2 import  matplotlib.pyplot as plt
 3 import numpy as np
 4
 5 # 显示中文标识
 6 matplotlib.rcParams["font.sans-serif"] = ["SimHei"]
 7 matplotlib.rcParams["axes.unicode_minus"] = False
 8
 9 font_style = dict(fontsize=18,weight="black")
10
11 x = np.linspace(0,2*np.pi,500)
12 y = np.sin(x) * np.exp(-x)
13
14 # 返回一个画布对象fig和一个坐标轴实例ax。使用sharey = True在matplotlib子图上标记标签
15 fig,ax = plt.subplots(1,2,sharey=True)
16 ax1 = ax[0]               # 1行2列的第1个子区
17 ax1.plot(x,y,"k--",lw=2)
18 ax1.set_title("折线图")
19 ax1.grid(ls=":",lw=2,color="gray",alpha=0.8)
20
21 ax2 = ax[1]               # 1行2列的第2个子区
22 ax2.scatter(x,y,s=10,c="skyblue",marker="o")
23 ax2.set_title("散点图")
24
25 plt.suptitle("创建一张画布两个子区的绘图模式")
26 plt.show()