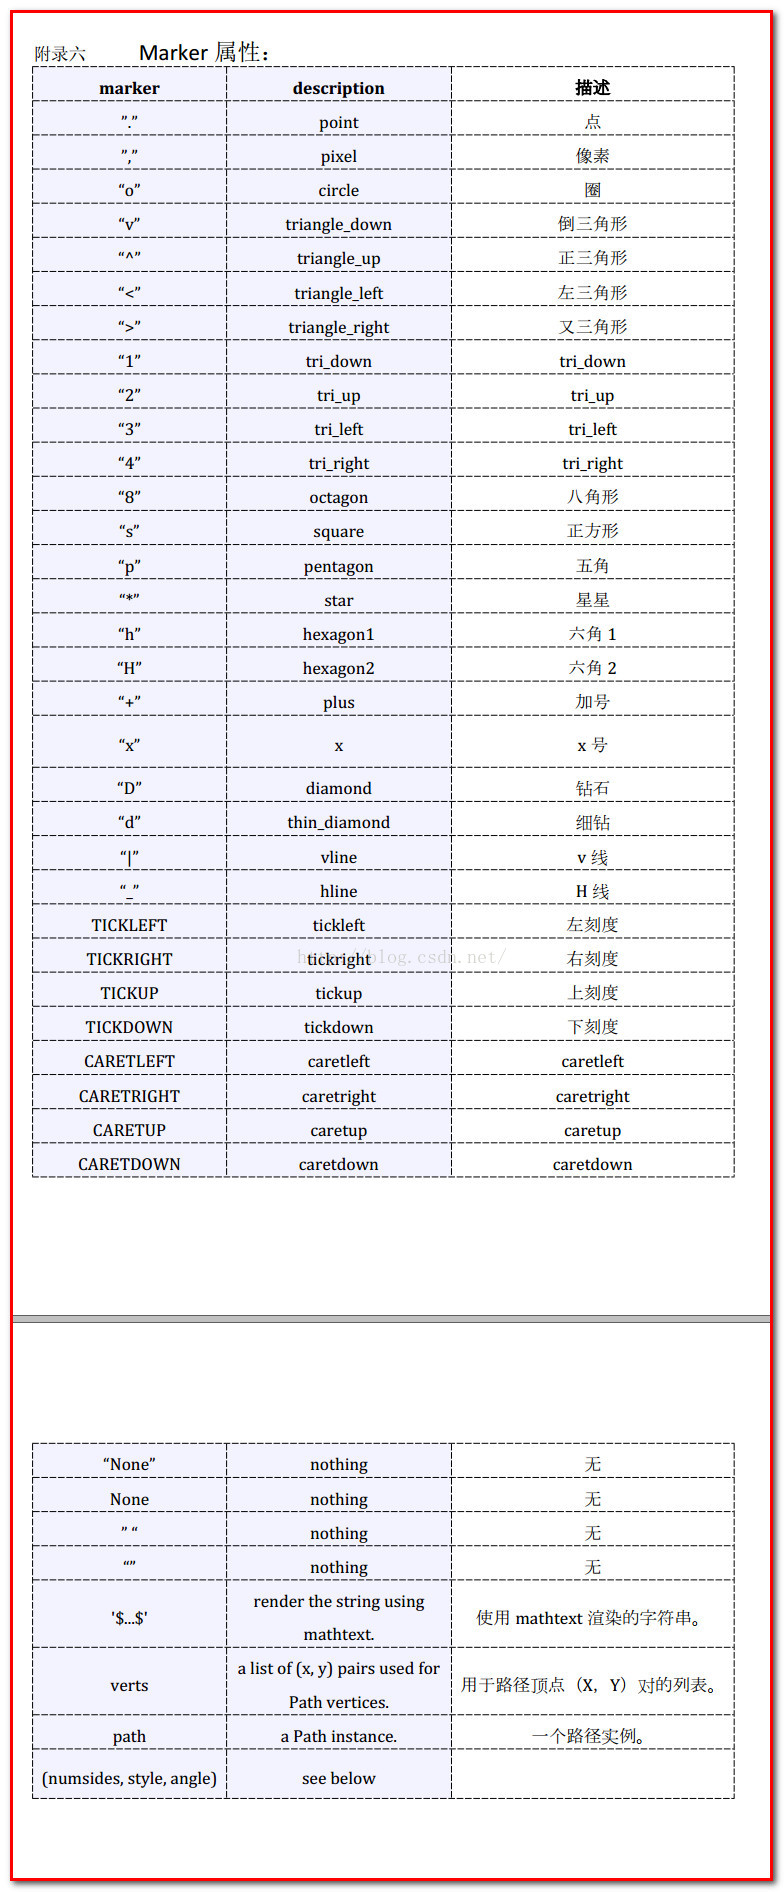
1、代码:
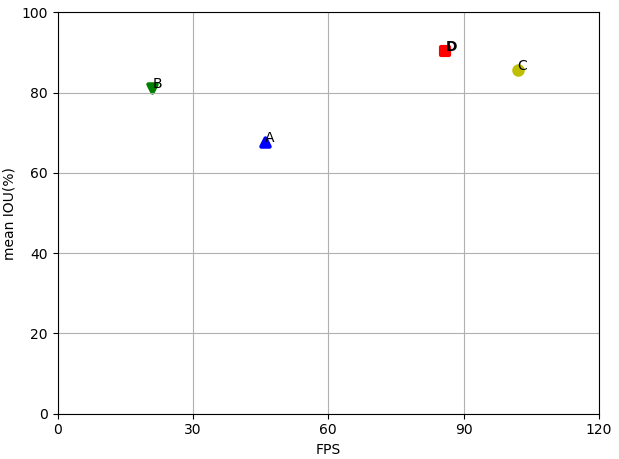
#coding:utf-8
#画图1,x轴:FPS,y轴:mean IOU
#pylab.plot画点时的形状颜色配合:
#符号:^ , v , < , > , s , + , x , D , d , 1 , 2 , 3 , 4 , h , H , p , | , _ , - , –, -., , . , , , o
#颜色:b, g, r, c, m, y, k, w


import os
import matplotlib.pyplot as plt
from pylab import plot
import pylab as pl

def main():
    method_dict = {'A':[67.84, 46, 'b', '^', 3, 3], 'B':[81.16, 21, 'g', 'v', 3, 3],
                   'C':[85.70, 102, 'y', 'o', 3, 3], 'D':[90.33, 86, 'r', 's', 3, 'bold']}
    fig, ax = plt.subplots()
    for i in method_dict:
        ax.scatter(method_dict[i][1], method_dict[i][0], c=method_dict[i][2], marker=method_dict[i][3], linewidths=method_dict[i][4])
        ax.annotate(i, (method_dict[i][1], method_dict[i][0]), weight=method_dict[i][5])
    plt.xlabel('FPS')
    plt.ylabel('mean IOU(%)')
    plt.xticks([0, 30, 60, 90, 120])
    plt.yticks([0, 20, 40, 60, 80, 100])
    plt.grid(True)
    plt.show()
    fig.savefig('plot.jpg')

if __name__ == "__main__":
    main()
2、效果:
3、scatter函数原型: