转自:https://www.jianshu.com/p/6e18d21a4cad
#-*- coding:utf-8 -*-
from __future__ import division
import numpy as np
import matplotlib.pyplot as plt
import seaborn as sns
seaborn.pairplot(data, hue=None, hue_order=None, palette=None, vars=None, x_vars=None, y_vars=None, kind='scatter', diag_kind='hist',
markers=None, size=2.5, aspect=1, dropna=True, plot_kws=None, diag_kws=None, grid_kws=None)
数据指定:
vars : 与data使用,否则使用data的全部变量。参数类型:numeric类型的变量list。
{x, y}_vars : 与data使用,否则使用data的全部变量。参数类型:numeric类型的变量list。
dropna : 是否剔除缺失值。参数类型:boolean, optional
特殊参数:
kind : {‘scatter’, ‘reg’}, optional Kind of plot for the non-identity relationships.
diag_kind : {‘hist’, ‘kde’}, optional。Kind of plot for the diagonal subplots.
基本参数:
size : 默认 6,图的尺度大小(正方形)。参数类型:numeric
hue : 使用指定变量为分类变量画图。参数类型:string (变量名)
hue_order : list of strings Order for the levels of the hue variable in the palette
palette : 调色板颜色
markers : 使用不同的形状。参数类型:list
aspect : scalar, optional。Aspect * size gives the width (in inches) of each facet.
{plot, diag, grid}_kws : 指定其他参数。参数类型:dicts
返回:
PairGrid 对象
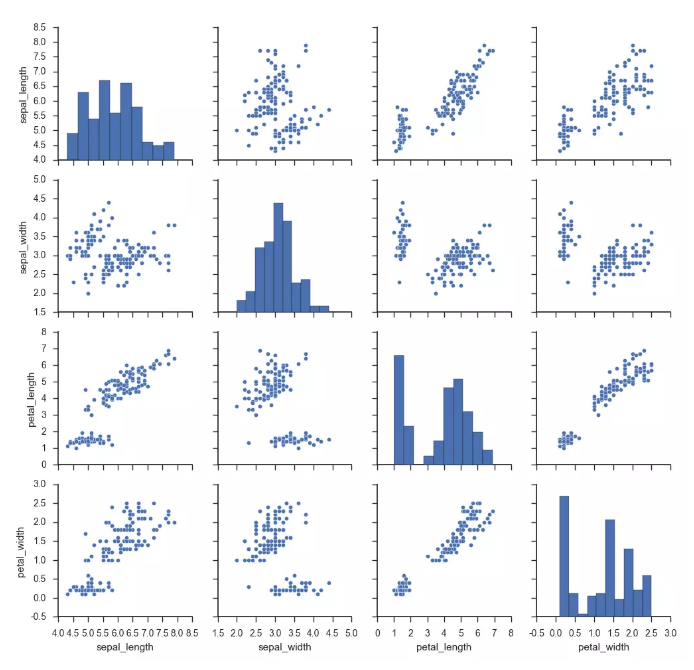
1.散点图
sns.set(style="ticks", color_codes=True)
iris = sns.load_dataset("iris")
g = sns.pairplot(iris)
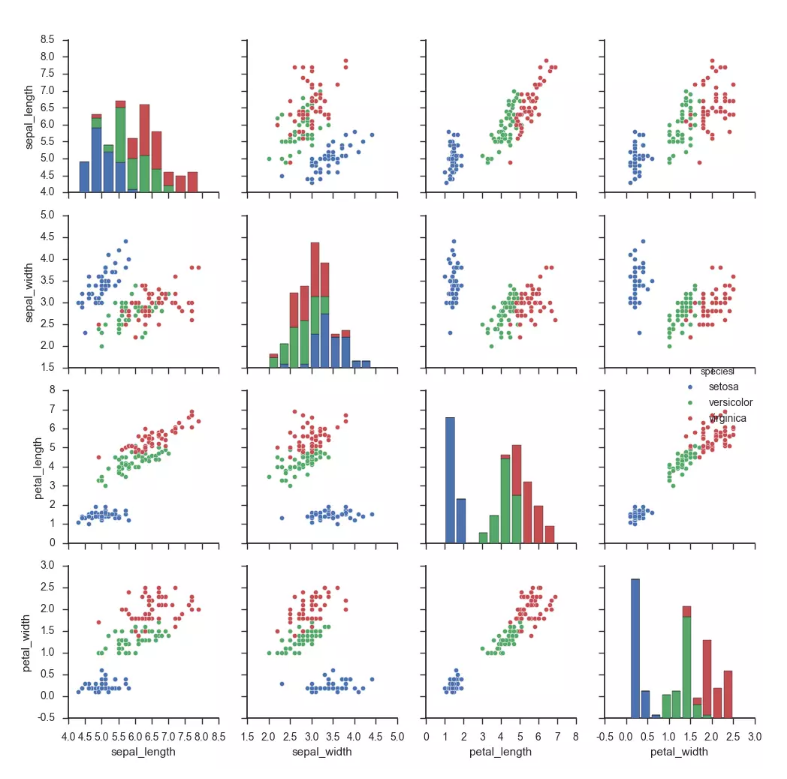
g2 = sns.pairplot(iris, hue="species")
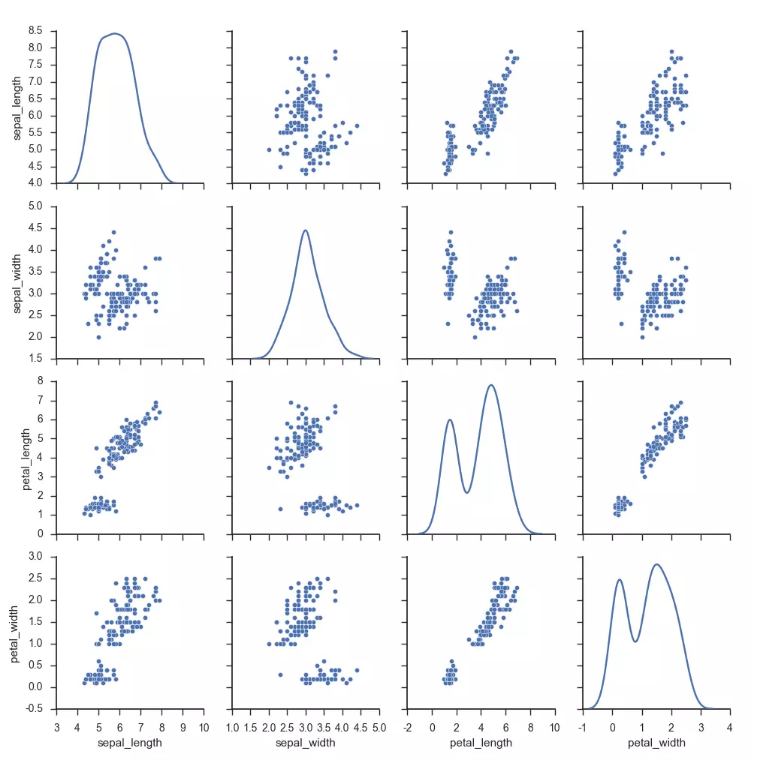
3. 改变对角图(KED)
g5 = sns.pairplot(iris, diag_kind="kde")
使用回归
g6 = sns.pairplot(iris, kind="reg")

4. 改变点形状,使用参数,使用edgecolor
g7 = sns.pairplot(iris, diag_kind="kde", markers="+",
                  plot_kws=dict(s=50, edgecolor="b", linewidth=1),
                  diag_kws=dict(shade=True))
