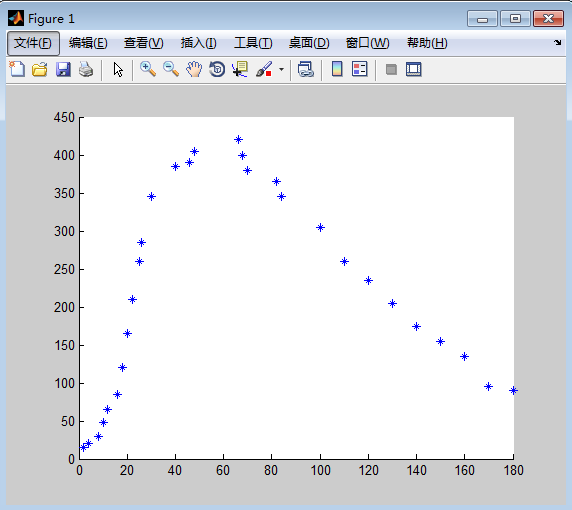
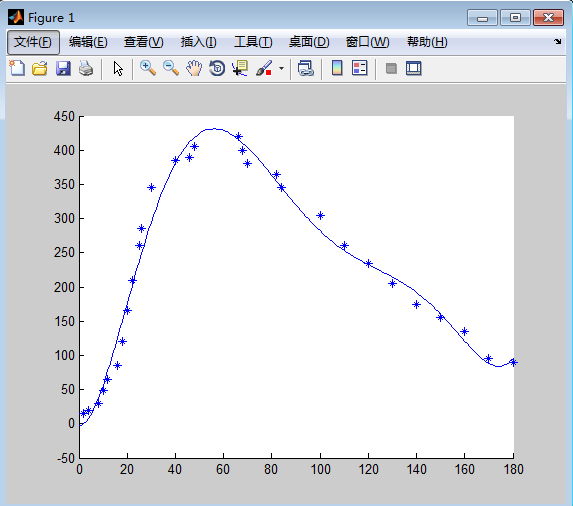
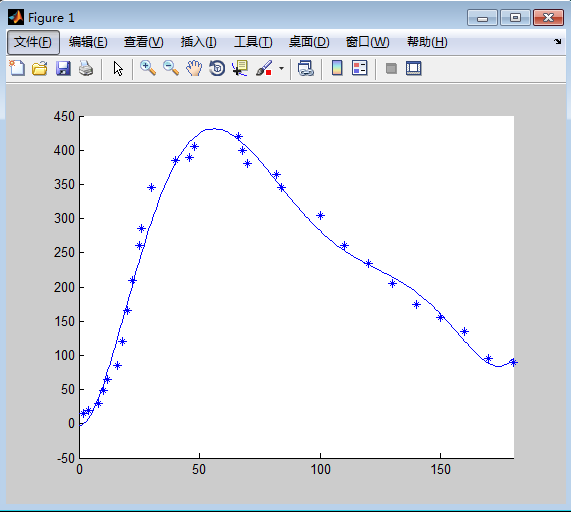
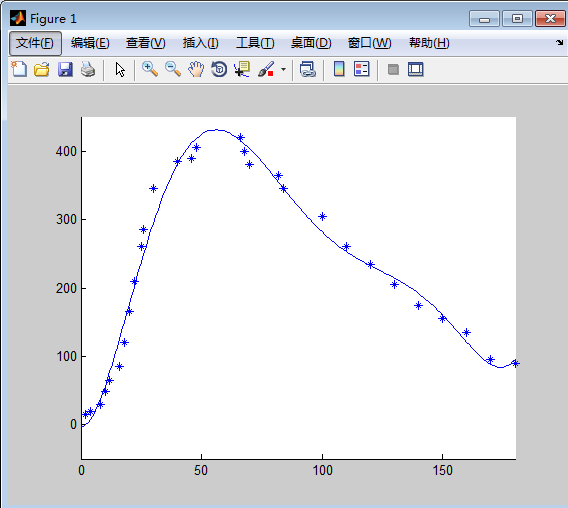
 1 x=[2;4;8;10;12;16;18;20;22;25;26;30;40;46;48;66;68;70;82;84;100;110;120;130;140;150;160;170;180];
 2 y=[15;20;30;48;65;85;120;165;210;260;285;345;385;390;405;420;400;380;365;345;305;260;235;205;175;155;135;95;90];
 3 p=polyfit(x,y,6);
 4 hold on;
 5 xx=0:180;
 6 y2=polyval(p,xx);
 7 h=plot(x,y,'*');
 8 plot(xx,y2);
 9 set(gca,'XTick',0:50:200);
10 set(gca,'YTick',0:100:500);
下来执行分布运行结果:
 1 x=[2;4;8;10;12;16;18;20;22;25;26;30;40;46;48;66;68;70;82;84;100;110;120;130;140;150;160;170;180];
 2 y=[15;20;30;48;65;85;120;165;210;260;285;345;385;390;405;420;400;380;365;345;305;260;235;205;175;155;135;95;90];
 3 p=polyfit(x,y,6);
 4 pause;
 5 hold on;
 6 xx=0:180;
 7 y2=polyval(p,xx);
 8 pause;
 9 h=plot(x,y,'*');
10 pause;
11 plot(xx,y2);
12 pause;
13 set(gca,'XTick',0:50:200);
14 pause;
15 set(gca,'YTick',0:100:500);
16 pause;