step0 activate bar charts and heatmaps
载入库文件
import pandas as pd
pd.plotting.register_matplotlib_converters()
import matplotlib.pyplot as plt
%matplotlib inline
import seaborn as sns
print("Setup Complete")
设置代码检测
# Set up code checking
import os
if not os.path.exists("../input/ign_scores.csv"):
    os.symlink("../input/data-for-datavis/ign_scores.csv", "../input/ign_scores.csv")
from learntools.core import binder
binder.bind(globals())
from learntools.data_viz_to_coder.ex3 import *
print("Setup Complete")
载入数据
ign_filepath="../inputs/ign_scores.csv"
ign_data=pd.read_csv(ign_filepath,index_col="Platform",parse_dates=True)
step_1.check()
step2 review the data
print the data
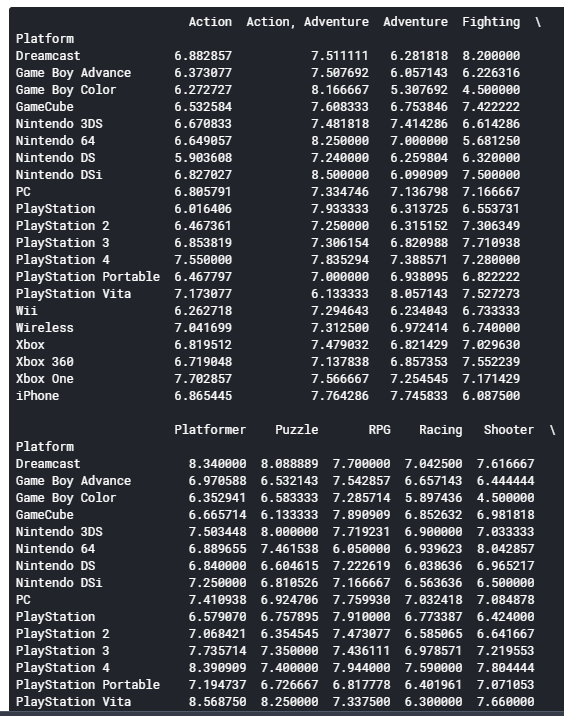
print(ign_data) # Your code here

取出数据,做测验并check
# Fill in the line below: What is the highest average score received by PC games,
# for any platform?
high_score = 7.759930

# Fill in the line below: On the Playstation Vita platform, which genre has the
# lowest average score? Please provide the name of the column, and put your answer
# in single quotes (e.g., 'Action', 'Adventure', 'Fighting', etc.)
worst_genre = 'Simulation'

# Check your answers
step_2.check()
step3 pick up the best platform
create a bar chart
plt.figure(figsize=(12,6))
sns.barplot(x=ign_data["Racing"],y=ign_data.index)
plt.title("X_label")
step_3.a.check()

step4 all possible combination
heatmap预备知识
import numpy as np
import seaborn as sns

data = np.array([[1,2,3],[4,5,6],[7,8,9]])
sns.heatmap(data,annot=True)

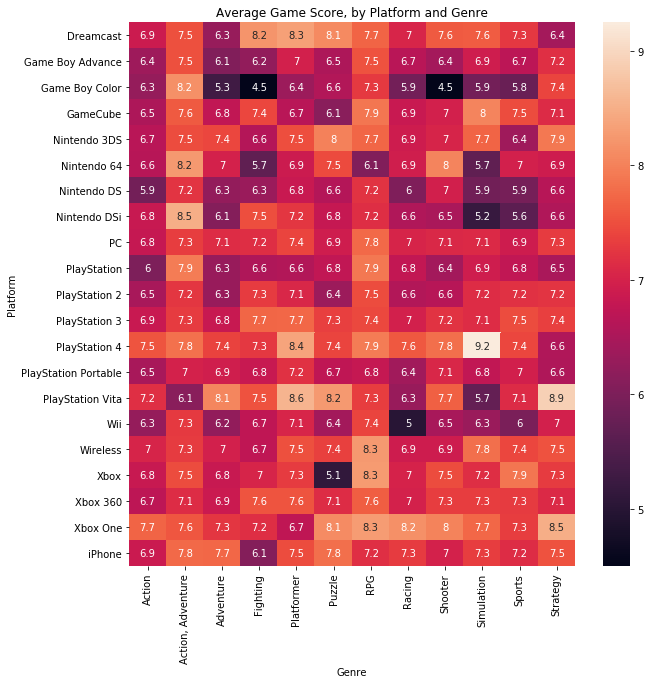
# Heatmap showing average game score by platform and genre
plt.figure(figsize=(10,10))
sns.heatmap(ign_data,annot=True)
plt.xlabel("Genre")
plt.title("Average Game Score, by Platform and Genre")

# Check your answer
step_4.a.check()