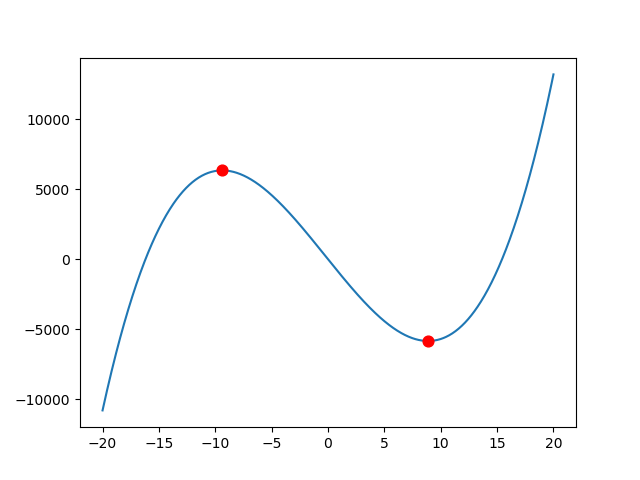
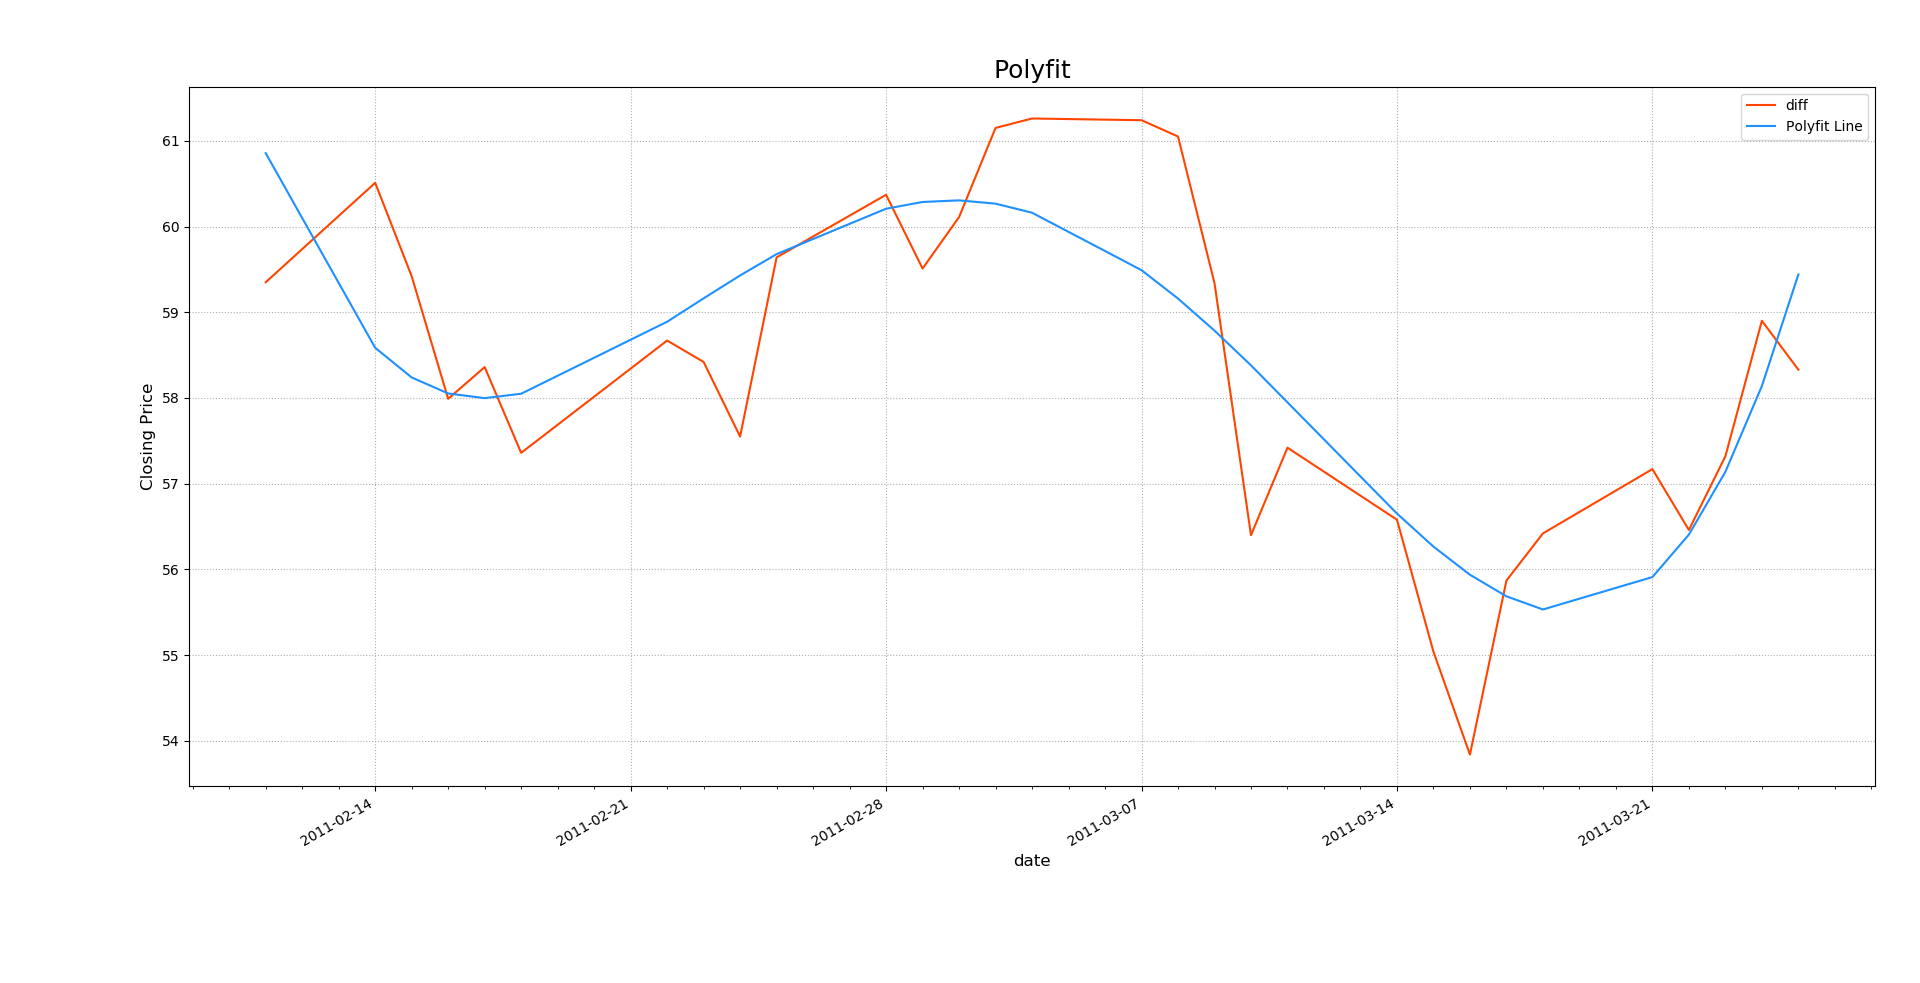
一、求多项式函数驻点问题
'''
    多项式操作
            ---求多项式函数 y = 4 * x ** 3 + 3 * x ** 2 - 1000 * x + 1的驻点
'''
import numpy as np
import matplotlib.pyplot as mp

x = np.linspace(-20, 20, 1000)
y = 4 * x ** 3 + 3 * x ** 2 - 1000 * x + 1

# 求多项式函数的导函数
P = [4, 3, -1000, 1]
Q = np.polyder(P)
# 得到驻点的横坐标
xs = np.roots(Q)
print(xs)
# 将横坐标带入多项式函数,得到纵坐标
Y = np.polyval(P, xs)
print(Y)
mp.scatter(xs, Y, s=60, color='red', marker='o', zorder=3)

mp.plot(x, y)
mp.show()


输出结果:
  [-9.38213192  8.88213192]
  [ 6343.77901003 -5841.52901003]

二、多项式拟合
'''
    基于多项式函数拟合两支股票差价的数组
    多项式拟合的本质:求取一组p0~pn,使得损失函数(loss)最小。
'''
import matplotlib.pyplot as mp
import numpy as np
import datetime as dt
import matplotlib.dates as md


# 日期转化函数
def dmy2ymd(dmy):
    # 把dmy格式的字符串转化成ymd格式的字符串
    dmy = str(dmy, encoding='utf-8')
    d = dt.datetime.strptime(dmy, '%d-%m-%Y')
    d = d.date()
    ymd = d.strftime('%Y-%m-%d')
    return ymd


dates, bhp_closing_prices =
    np.loadtxt('./da_data/bhp.csv', delimiter=',', usecols=(1, 6), unpack=True,
               dtype='M8[D], f8', converters={1: dmy2ymd})  # converters为转换器,运行时先执行,其中1表示时间所在的列索引号

vale_closing_prices =
    np.loadtxt('./da_data/vale.csv', delimiter=',', usecols=(6,), unpack=True,
               dtype='f8')

# 绘制收盘价折线图
mp.figure('Polyfit', facecolor='lightgray')
mp.title('Polyfit', fontsize=18)
mp.xlabel('date', fontsize=12)
mp.ylabel('Closing Price', fontsize=12)
mp.tick_params(labelsize=10)
mp.grid(linestyle=':')
# 设置x轴的刻度定位器,使之更适合显示日期数据
ax = mp.gca()
# 以周一作为主刻度
ma_loc = md.WeekdayLocator(byweekday=md.MO)
# 次刻度,除周一外的日期
mi_loc = md.DayLocator()
ax.xaxis.set_major_locator(ma_loc)
ax.xaxis.set_major_formatter(md.DateFormatter('%Y-%m-%d'))
ax.xaxis.set_minor_locator(mi_loc)
# 日期数据类型转换,更适合绘图
dates = dates.astype(md.datetime.datetime)

# 得到两支股票的差价数据
diff_prices = bhp_closing_prices - vale_closing_prices
mp.plot(dates, diff_prices, color='orangered', label='diff')

# 多项式拟合差价数据
days = dates.astype('M8[D]').astype('i4')
P = np.polyfit(days, diff_prices, 4)
pred_prices = np.polyval(P, days)
mp.plot(dates, pred_prices, color='dodgerblue', label='Polyfit Line')

mp.tight_layout()
mp.legend()
# 自动格式化x轴日期的显示格式(以最合适的方式显示)
mp.gcf().autofmt_xdate()
mp.show()
