import numpy as np
import matplotlib.pyplot as mp
import datetime as dt
import matplotlib.dates as md


# 日期转化函数
def dmy2ymd(dmy):
    # 把dmy格式的字符串转化成ymd格式的字符串
    dmy = str(dmy, encoding='utf-8')
    d = dt.datetime.strptime(dmy, '%d-%m-%Y')
    d = d.date()
    ymd = d.strftime('%Y-%m-%d')
    return ymd


dates, opening_prices, highest_prices, lowest_prices, closing_prices =
    np.loadtxt('./da_data/aapl.csv', delimiter=',', usecols=(1, 3, 4, 5, 6), unpack=True,
               dtype='M8[D], f8, f8, f8, f8', converters={1: dmy2ymd})  # converters为转换器,运行时先执行,其中1表示时间所在的列索引号

# 绘制收盘价折线图
mp.figure('AAPL', facecolor='lightgray')
mp.title('AAPL', fontsize=18)
mp.xlabel('date', fontsize=12)
mp.ylabel('closing_pricing', fontsize=12)
mp.tick_params(labelsize=10)
mp.grid(linestyle=':')
# 设置x轴的刻度定位器,使之更适合显示日期数据
ax = mp.gca()
# 以周一作为主刻度
ma_loc = md.WeekdayLocator(byweekday=md.MO)
# 次刻度,除周一外的日期
mi_loc = md.DayLocator()
ax.xaxis.set_major_locator(ma_loc)
ax.xaxis.set_major_formatter(md.DateFormatter('%Y-%m-%d'))
ax.xaxis.set_minor_locator(mi_loc)
# 日期数据类型转换,更适合绘图
dates = dates.astype(md.datetime.datetime)
mp.plot(dates, closing_prices, linewidth=2, linestyle='--', color='dodgerblue', label='AAPL')

mp.tight_layout()
mp.legend()
# 自动格式化x轴日期的显示格式(以最合适的方式显示)
mp.gcf().autofmt_xdate()
mp.show()
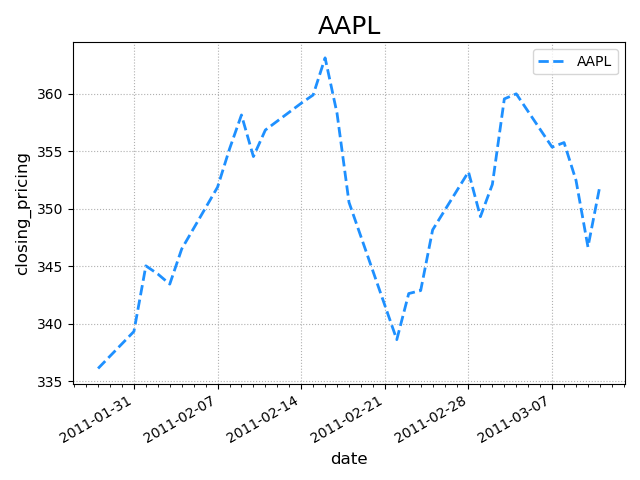
import numpy as np
import matplotlib.pyplot as mp
import datetime as dt
import matplotlib.dates as md


# 日期转化函数
def dmy2ymd(dmy):
    # 把dmy格式的字符串转化成ymd格式的字符串
    dmy = str(dmy, encoding='utf-8')
    d = dt.datetime.strptime(dmy, '%d-%m-%Y')
    d = d.date()
    ymd = d.strftime('%Y-%m-%d')
    return ymd


dates, opening_prices, highest_prices, lowest_prices, closing_prices =
    np.loadtxt('./da_data/aapl.csv', delimiter=',', usecols=(1, 3, 4, 5, 6), unpack=True,
               dtype='M8[D], f8, f8, f8, f8', converters={1: dmy2ymd})  # converters为转换器,运行时先执行,其中1表示时间所在的列索引号

# 绘制收盘价折线图
mp.figure('AAPL', facecolor='lightgray')
mp.title('AAPL', fontsize=18)
mp.xlabel('date', fontsize=12)
mp.ylabel('closing_pricing', fontsize=12)
mp.tick_params(labelsize=10)
mp.grid(linestyle=':')
# 设置x轴的刻度定位器,使之更适合显示日期数据
ax = mp.gca()
# 以周一作为主刻度
ma_loc = md.WeekdayLocator(byweekday=md.MO)
# 次刻度,除周一外的日期
mi_loc = md.DayLocator()
ax.xaxis.set_major_locator(ma_loc)
ax.xaxis.set_major_formatter(md.DateFormatter('%Y-%m-%d'))
ax.xaxis.set_minor_locator(mi_loc)
# 日期数据类型转换,更适合绘图
dates = dates.astype(md.datetime.datetime)
mp.plot(dates, closing_prices, linewidth=2, linestyle='--', color='dodgerblue', label='AAPL', alpha=0.4)

# 绘制蜡烛图
# 整理颜色
rise = closing_prices > opening_prices  # 掩码数组(布尔类型)
color = np.array([('white' if x else 'green') for x in rise])
ecolor = np.array([('red' if x else 'green') for x in rise])
print(color)
# 绘制实体
mp.bar(dates, closing_prices - opening_prices, width=0.8, bottom=opening_prices, color=color, edgecolor=ecolor,
       zorder=3)
# 绘制影线
mp.vlines(dates, lowest_prices, highest_prices, color=ecolor)
mp.tight_layout()
mp.legend()
# 自动格式化x轴日期的显示格式(以最合适的方式显示)
mp.gcf().autofmt_xdate()
mp.show()

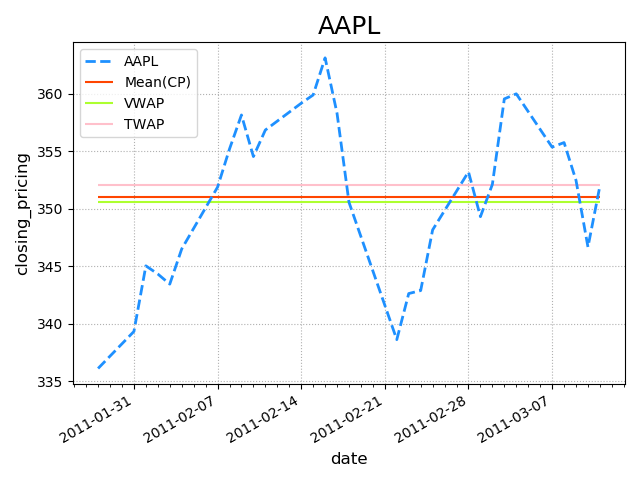
numpy常见统计量API
import numpy as np
import matplotlib.pyplot as mp
import datetime as dt
import matplotlib.dates as md

'''
    1.算数平均值:收盘价均值计算
    2.加权平均值:交易量加权平均价格(VWAP)---交易量体现了市场对当前交易价格的认可度,交易量越高表示市场对当前的价格越认可,该价格越接近股票价值的真值
    3.最值:波动性
'''


# 日期转化函数
def dmy2ymd(dmy):
    # 把dmy格式的字符串转化成ymd格式的字符串
    dmy = str(dmy, encoding='utf-8')
    d = dt.datetime.strptime(dmy, '%d-%m-%Y')
    d = d.date()
    ymd = d.strftime('%Y-%m-%d')
    return ymd


dates, opening_prices, highest_prices, lowest_prices, closing_prices, volumns =
    np.loadtxt('./da_data/aapl.csv', delimiter=',', usecols=(1, 3, 4, 5, 6, 7), unpack=True,
               dtype='M8[D], f8, f8, f8, f8, f8', converters={1: dmy2ymd})  # converters为转换器,运行时先执行,其中1表示时间所在的列索引号

# 评估AAPL股票波动性
max_val = np.max(highest_prices)
min_val = np.min(lowest_prices)
print(max_val, '~', min_val)
# 查看最高价和最低价的日期
print('max_date:', dates[np.argmax(highest_prices)])
print('min_date:', dates[np.argmin(lowest_prices)])

# 绘制收盘价折线图
mp.figure('AAPL', facecolor='lightgray')
mp.title('AAPL', fontsize=18)
mp.xlabel('date', fontsize=12)
mp.ylabel('closing_pricing', fontsize=12)
mp.tick_params(labelsize=10)
mp.grid(linestyle=':')
# 设置x轴的刻度定位器,使之更适合显示日期数据
ax = mp.gca()
# 以周一作为主刻度
ma_loc = md.WeekdayLocator(byweekday=md.MO)
# 次刻度,除周一外的日期
mi_loc = md.DayLocator()
ax.xaxis.set_major_locator(ma_loc)
ax.xaxis.set_major_formatter(md.DateFormatter('%Y-%m-%d'))
ax.xaxis.set_minor_locator(mi_loc)
# 日期数据类型转换,更适合绘图
dates = dates.astype(md.datetime.datetime)
mp.plot(dates, closing_prices, linewidth=2, linestyle='--', color='dodgerblue', label='AAPL')
# 计算均值,绘制图像
mean = np.mean(closing_prices)
mp.hlines(mean, dates[0], dates[-1], color='orangered', label='Mean(CP)')
# 计算VWAP交易量加权平均值
avg1 = np.average(closing_prices, weights=volumns)
mp.hlines(avg1, dates[0], dates[-1], colors='greenyellow', label='VWAP')
# 计算TWAP时间加权平均值---越靠近当前时间的收盘价对均值的影响程度越高
w = np.linspace(1, 7, 30)
avg2 = np.average(closing_prices, weights=w)
mp.hlines(avg2, dates[0], dates[-1], colors='pink', label='TWAP')

mp.tight_layout()
mp.legend()
# 自动格式化x轴日期的显示格式(以最合适的方式显示)
mp.gcf().autofmt_xdate()
mp.show()