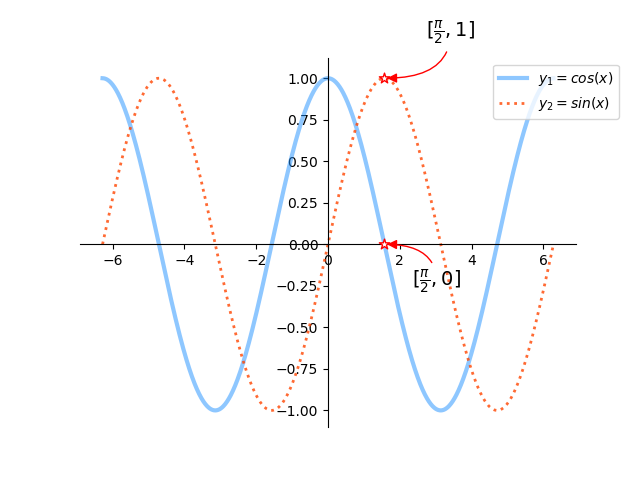
import matplotlib.pyplot as mp
import numpy as np

x = np.linspace(-2 * np.pi, 2 * np.pi, 1000)
y1 = np.cos(x)
y2 = np.sin(x)
mp.xticks([-2 * np.pi, -3 / 2 * np.pi, -np.pi, -1 / 2 * np.pi, 0, 1 / 2 * np.pi, np.pi, 3 / 2 * np.pi, 2 * np.pi],
          [r'$-2pi$', r'$-frac{3pi}{2}$', r'$-pi$', r'$-frac{pi}{2}$', r'$0$', r'$frac{pi}{2}$', r'$pi$',
           r'$frac{3pi}{2}$',
           r'$2pi$'])
mp.yticks([-2, -1.5, -1, -0.5, 0, 0.5, 1, 1.5, 2])
mp.figure('哈哈', facecolor='lightgray')
mp.plot(x, y1, linestyle='-', linewidth=3, color='dodgerblue', alpha=0.5, label=r'$y_1 = cos(x)$')
mp.figure('哈哈', facecolor='lightgray')
mp.plot(x, y2, linestyle=':', linewidth=2, color='orangered', alpha=0.8, label=r'$y_2 = sin(x)$')
ax = mp.gca()
ax.spines['top'].set_color('none')
ax.spines['right'].set_color('none')
ax.spines['left'].set_position(('data', 0))
ax.spines['bottom'].set_position(('data', 0))
# 设置特殊点文本
mp.annotate(r'$[frac{pi}{2},1]$', xycoords='data', xy=(np.pi / 2, 1), textcoords="offset points", xytext=(30, 30),
            fontsize=14, arrowprops=dict(arrowstyle='-|>', connectionstyle='angle3', color='red'))
mp.annotate(r'$[frac{pi}{2},0]$', xycoords='data', xy=(np.pi / 2, 0), textcoords="offset points", xytext=(20, -30),
            fontsize=14, arrowprops=dict(arrowstyle='-|>', connectionstyle='angle3', color='red'))
mp.scatter([np.pi / 2, np.pi / 2], [0, 1], marker='*', s=60, facecolor=(1, 1, 1, 1), edgecolor='red', zorder=3)
# mp.hlines(1, -8, 8, colors='red', linestyles='--', linewidth=2)
# mp.hlines(-1, -8, 8, colors='red', linestyles='--', linewidth=2)

# mp.xlim(0, np.pi)
# mp.ylim(0, 1)
mp.legend(loc=1, bbox_to_anchor=(1.1, 1))
mp.show()