option = {
xAxis: {
type: 'category',
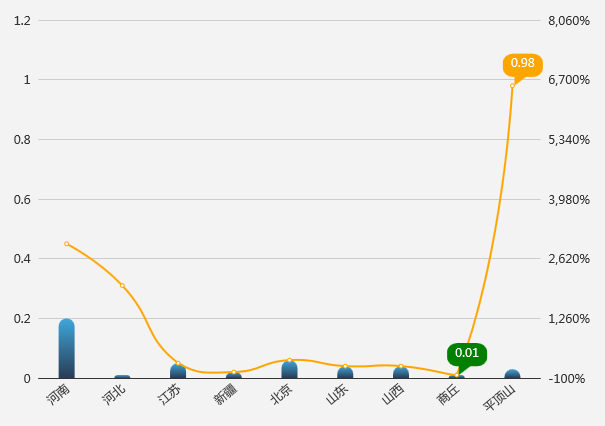
data: ['河南', '河北', '江苏', '新疆', '北京', '山东', '山西',"商丘","平顶山"],
axisTick: {show: false},
axisLabel:{
rotate:40,
}
},
yAxis:[
{
min:0,
max:1.2,
interval:0.2,
axisLine:{show:false},
axisTick: {show: false}
},
{
min:-100,
max:8060,
interval:1360,
axisLine:{show:false},
axisTick: {show: false},
axisLabel:{
formatter: '{value}%',
}
}
],
series: [
{
name:"本期",
data: [0.2, 0.01, 0.05, 0.02, 0.06, 0.04, 0.04,0.01,0.03],
type: 'bar',
barWidth:16,
barGap:0,
itemStyle:{
barBorderRadius:[10,10,0,0],
color: new echarts.graphic.LinearGradient(0, 1, 0, 0, [{
offset: 0,
color: "#293c55" // 0% 处的颜色
}, {
offset: 1,
color: "#3fa7dc" // 100% 处的颜色
}], false)
},
},
{
name:"同期",
data: [0.45, 0.31, 0.05, 0.02, 0.06, 0.04, 0.04,0.01,0.98],
type:"line",
smooth:true,
itemStyle:{
color: "orange"
},
markPoint: { //图表标注
data: [
{
type: 'max',
name: '最大值',
itemStyle:{ //自定义标注的颜色
color:"orange"
}
},
{
type: 'min',
name: '最小值',
itemStyle:{ //自定义标注的颜色
color:"green"
}
}
],
label:{
position:"insideTop" ,//标注文字位置
distance:3 //距离图形元素的距离
},
symbolSize:[40,32],
symbolOffset: ['26%', '-50%'], //图标偏移
animation:true,
symbol:"path://M736 101.3H288c-123.2 0-224 100.8-224 224v149.3c0 123.2 100.8 224 224 224h37.3v224l256-224H736c123.2 0 224-100.8 224-224V325.3c0-123.2-100.8-224-224-224z"
}
},
]
};