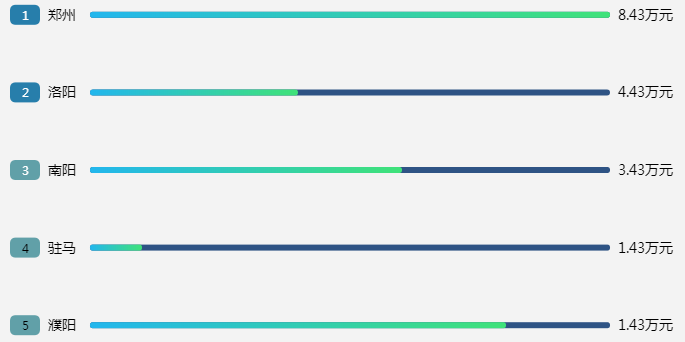
echarts 柱状图

var index = 0;
var colorList = ['#fff', '#000'];
option = {
    // backgroundColor:"#17326b",
    grid:{
        left:"80",
        top:"10",
        right:"60",
        bottom:"60",
        containLabel:true
    },
    xAxis: {
        show:false
    },
    yAxis:[
       {
            type: 'category',
            axisTick:{show:false},
            axisLine:{show:false},
            axisLabel:{
                color:"black",
                fontSize:14,
                padding:[0,6,0,0],
                textStyle: {
                      color: '#000',
                   
                },
                rich: {
                    a1: {
                        color:  colorList[0],
                         30,
                        height: 20,
                        align: 'center',
                        backgroundColor:"#277eab",
                        borderRadius:6
                    },
                    a2: {
                        color: colorList[0],
                         30,
                        height: 20,
                        align: 'center',
                        backgroundColor:"#277eab",
                        borderRadius:6
                    },
                    a3: {
                        color: colorList[0],
                         30,
                        height: 20,
                        align: 'center',
                        backgroundColor:"#61a0a8",
                        borderRadius:6
                    },
                    b: {
                        color:colorList[1],
                         30,
                        height: 20,
                        align: 'center',
                        backgroundColor:"#61a0a8",
                        borderRadius:6
                    }
                },
                formatter: function(params) {
                    if (index == 5) {
                        index = 0;
                    }
                    index++;
                    if (index - 1 < 3) {
                        return [
                            '{a' + index + '|' + index + '}' + '  ' + params
                        ].join('
').substring(0,10)
                    } else {
                        return [
                            '{b|' + index + '}' + '  ' + params
                        ].join('
').substring(0, 9)
                    }
                    
                },
                
            },
            
            data:["郑州","洛阳","南阳","驻马店","濮阳"],
            inverse:true,
            // scale:true,
          
        },
         {
            type: 'category',
            axisTick:{show:false},
            axisLine:{show:false},
            axisLabel:{
                color:"black",
                fontSize:14,
                textStyle: {
                      color: '#000'
                }
            },
            data:["8.43万元","4.43万元","3.43万元","1.43万元","1.43万元"],
            inverse:true,
            
            
        }
    ],
    series: [
      {
        name:"条",
        type:"bar",
        barWidth:6,
        data:[100,40,60,10,80],
        barCategoryGap:10,
        itemStyle:{
            normal:{
                barBorderRadius:10,
                color: new echarts.graphic.LinearGradient(0, 0, 1, 0, [{
                  offset: 0,
                  color: '#22b6ed'
                }, {
                  offset: 1,
                  color: '#3fE279'
                }]),
            }
        },
        zlevel:1
        
      },{
          name:"进度条背景",
          type:"bar",
          barGap:"-100%",
          barWidth:6,
          data:[100,100,100,100,100],
          color:"#2e5384",
          itemStyle:{
              normal:{
                  barBorderRadius:10
              }
          },
      }
    ]
};
原文地址:https://www.cnblogs.com/yunyin/p/13913129.html